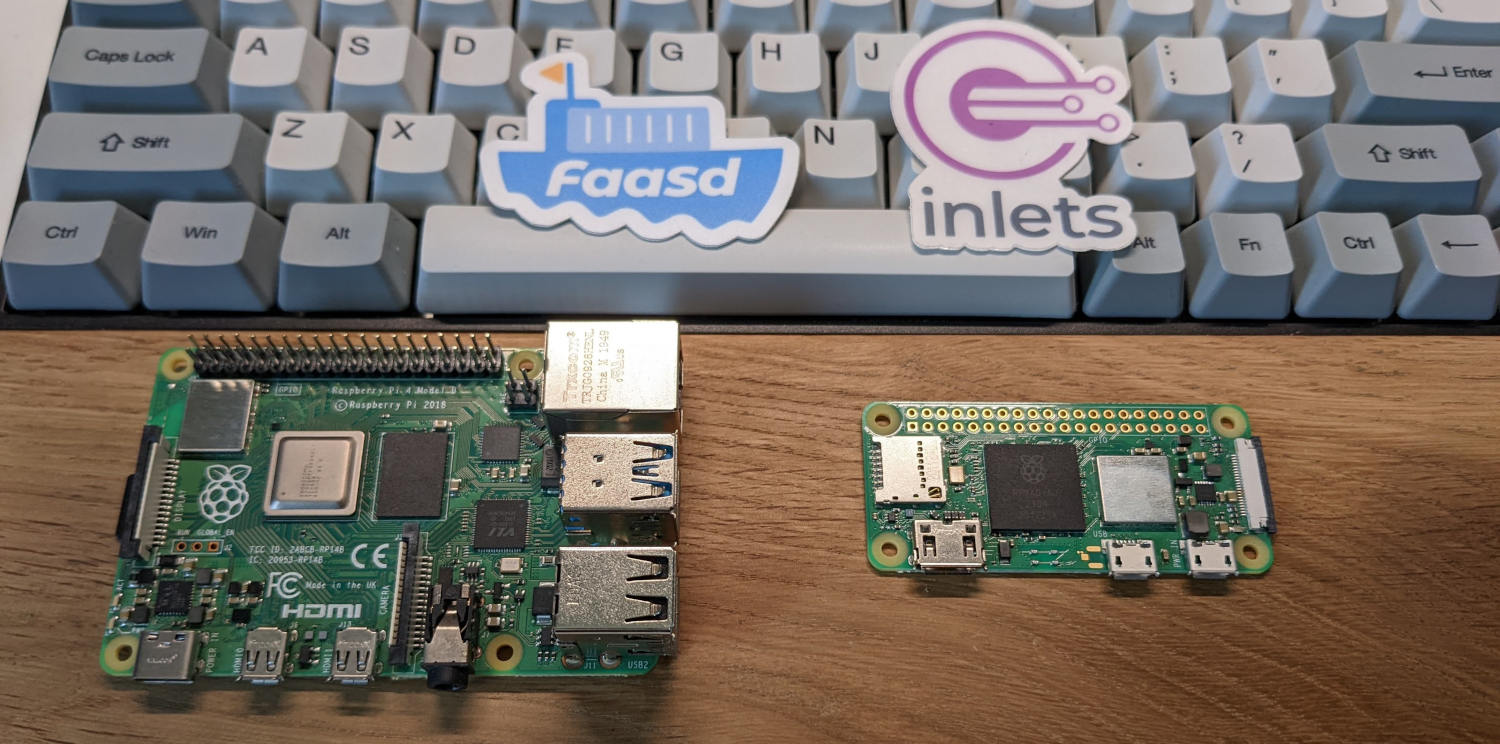
Many of us own at least one Raspberry Pi, and if it's not doing duty as a media player, retro gaming console, blocking ads, or reporting the weather, then it may well be gathering dust.
I'm writing this article as an excuse for you to blow the dust off those microchips, and to put your pocket-sized silicon to work as the world's smallest API-driven cloud.
By following the instructions in this article, you'll be able to deploy scheduled tasks, webhook receivers, web pages and functions to your pocket-sized cloud from anywhere using a REST API.
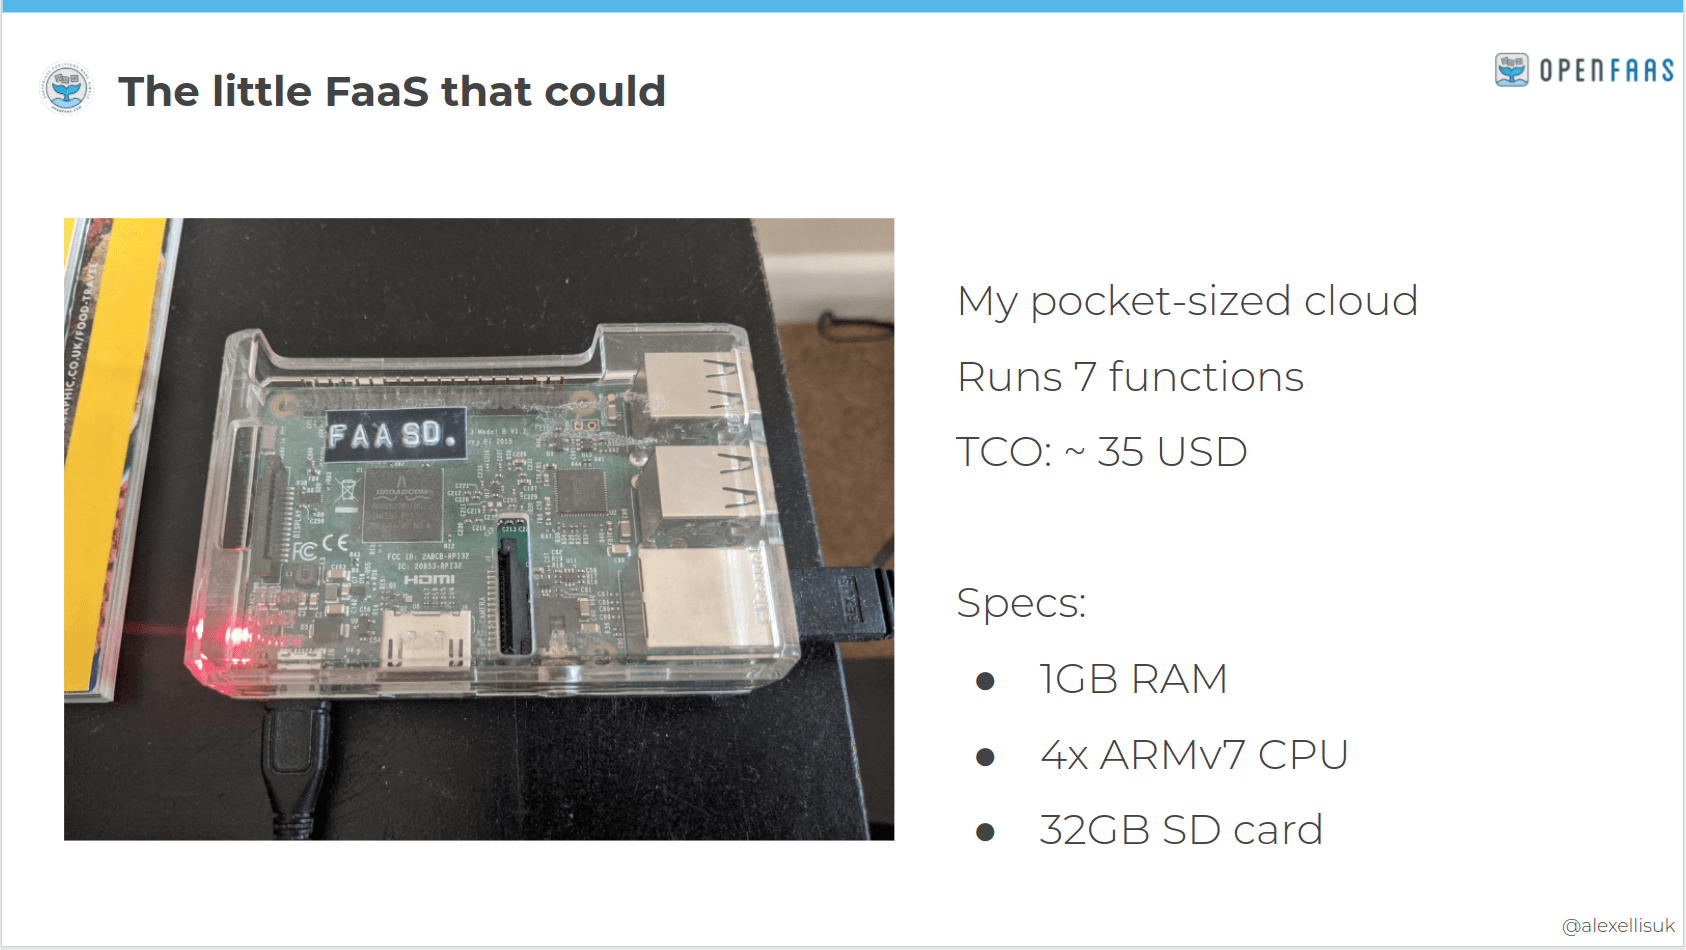
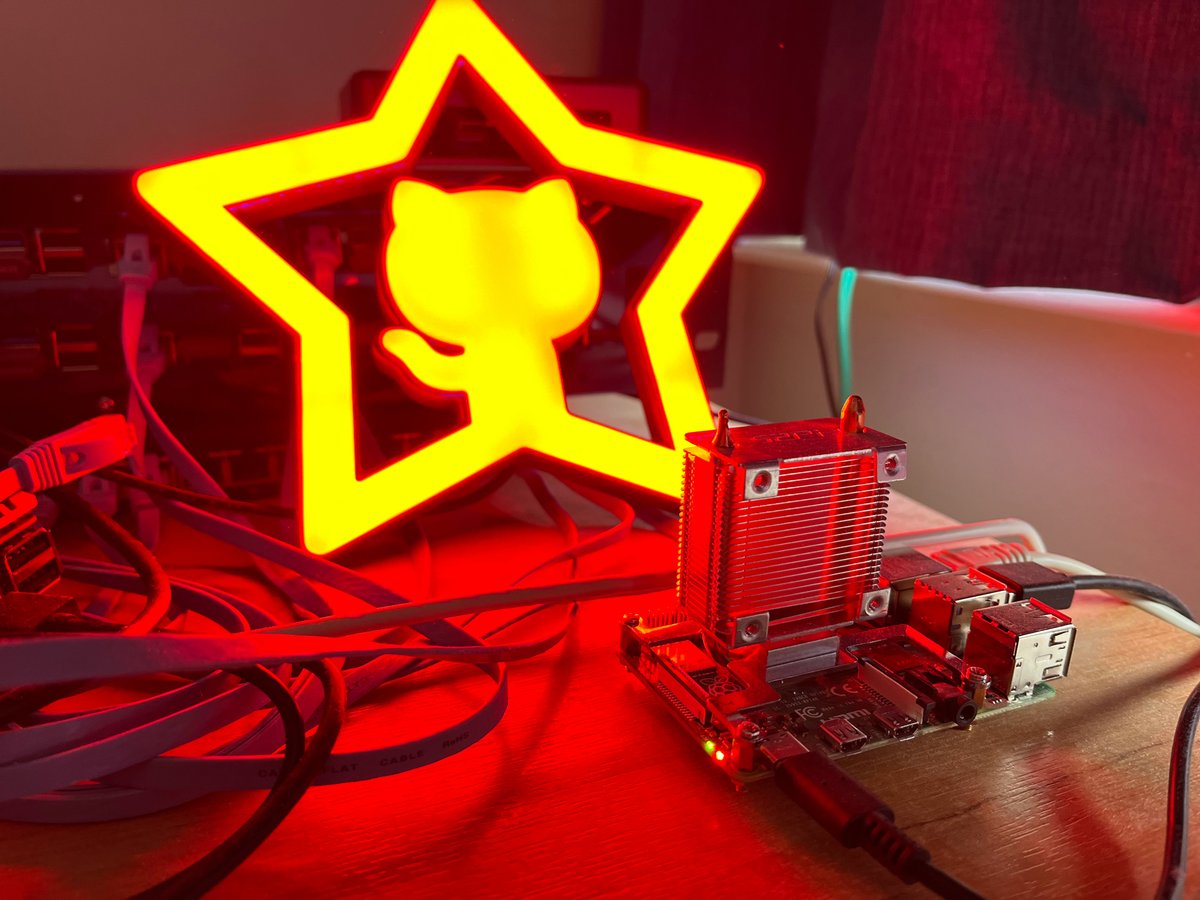
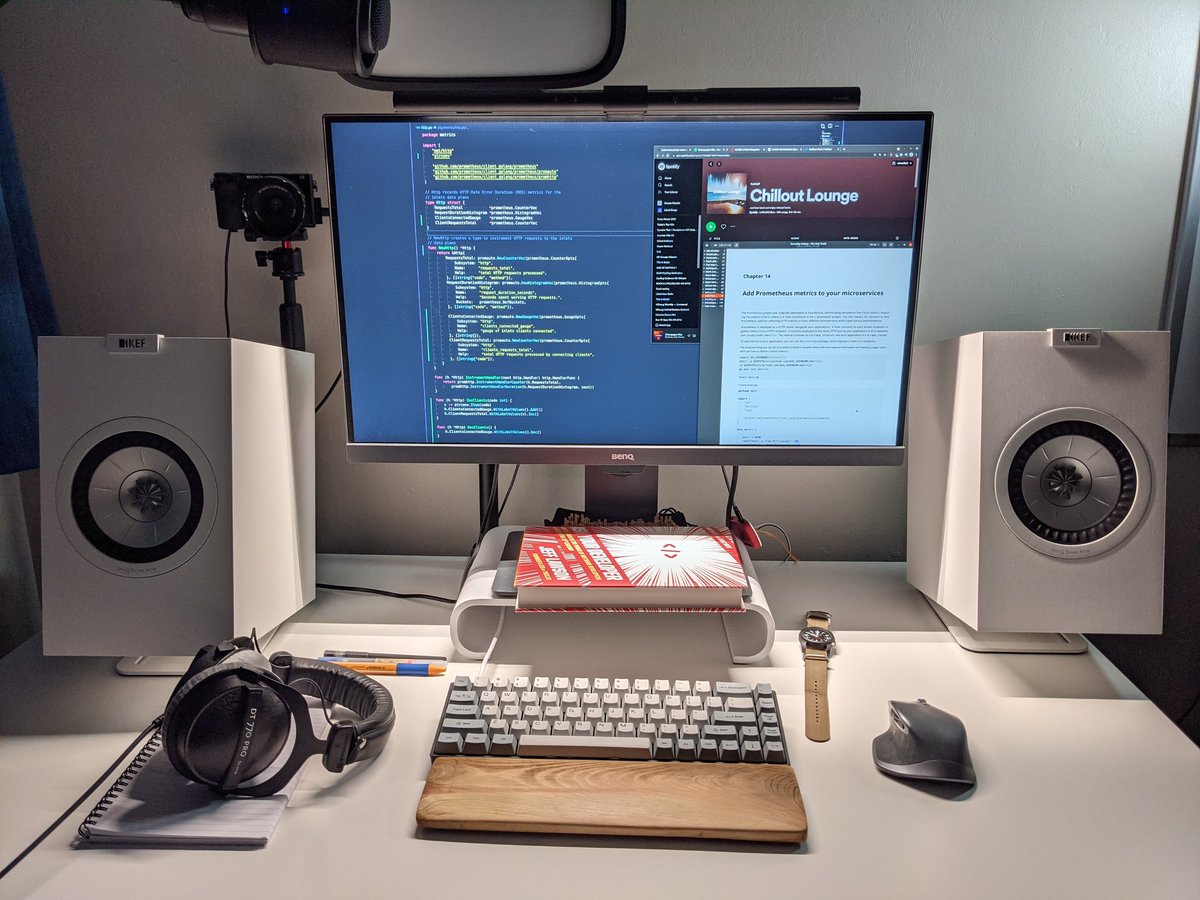
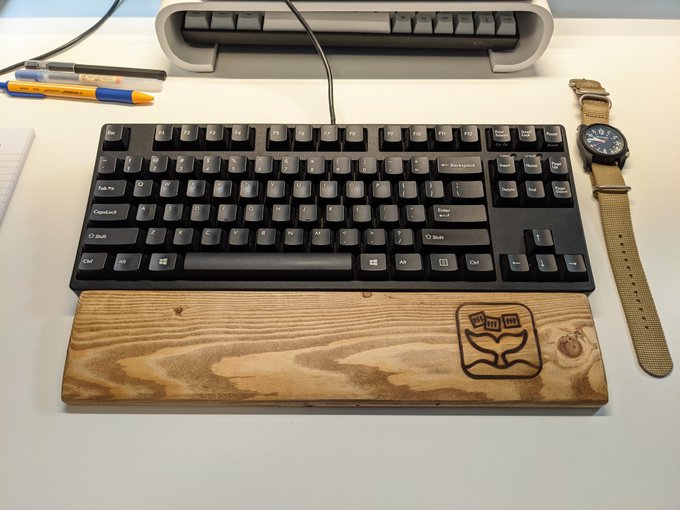
My own pocket-sized cloud, running 7x applications 24/7 on a Raspberry Pi 3 in my lounge.
Outline:
- What's a full-size cloud look like?
- A pocket-sized definition
- Dust off your Raspberry Pi
- Set up faasd for API-driven deployments
- Try out a store function
- Explore the asynchronous invocation system
- Deploy with GitHub Actions
- Explore monitoring and metrics
- Conclusion and further resources
Join me for a live stream on YouTube - Friday 25th March 12.00-13.30 GMT - Your pocket-sized cloud with OpenFaaS and GitHub Actions
Follow me, or share & discuss this article on Twitter
What's a full-size cloud look like?
According to NIST's final defintion of cloud:
"cloud computing is a model for enabling ubiquitous, convenient, on-demand network access to a shared pool of configurable computing resources (e.g., networks, servers, storage, applications and services) that can be rapidly provisioned and released with minimal management effort or service provider interaction."
When I read this definition, it seems like the authors are describing a managed cloud provider like AWS, GCP or some installable software like Kubernetes or one of the major hypervisors.
Now, we cannot get AWS from our Raspberry Pis, but we can get quite close to large parts of the definition by installing Kubernetes to a cluster of Raspberry Pis, configuring a network storage layer and using netbooting for easy provisioning and reconfiguration of hosts. I talk about how to do this in my workshop: Netbooting workshop for Raspberry Pi with K3s
But we're not going to do that for two reasons. The first is that there's a shortage of Raspberry Pis, so this is really about using one of your existing devices, and putting it to work. The second is that there's a non-trivial cost to Kubernetes, which isn't entirely necessary for a pocket-sized cloud.
A pocket-sized definition
Our definition of cloud is going to be scaled down, to fit in your pocket, in less than 1GB of RAM. What we're building today is a place to run our code, which can be configured through an API - using containers for packaging, so that it's easy to automate and maintain. We will have a single point of failure in the architecture, but we'll counter that by using an NVMe SSD instead of an SD card, which extends our time to failure of storage. The software is easy to deploy, so we can reduce our Mean Time To Recovery (MTTR) to a few minutes.
Getting to API-driven deployments
I spend a bit too much of my time on Twitter, and have quite often seen tweets that go a bit like this:
"I've written a HTTP server in Go/Python/Node and deployed it to a VM somewhere, but now I don't know how to re-deploy it remotely"
In the good old days, we would use FTP, or SFTP to transfer code or binaries to production, and then an SSH connection or control-panel UI to restart the service. That is probably one of the simplest solutions available today, but it's hardly "API-driven".
What if you could package your code in a container and then deploy the new version with a curl request?
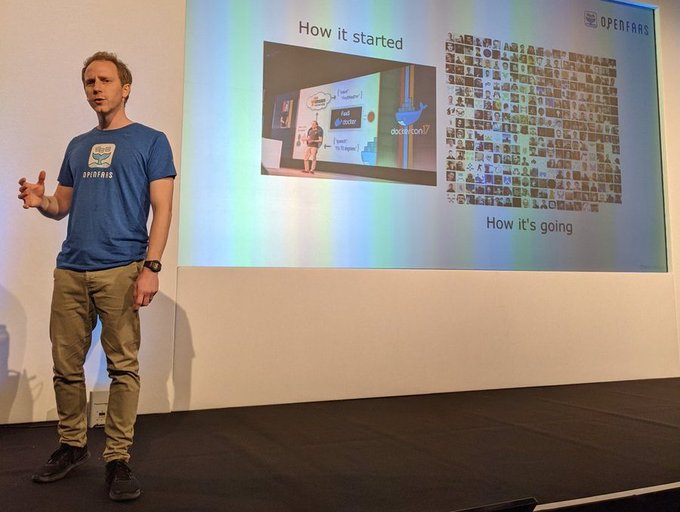
You may have heard of OpenFaaS - a project I started in 2016 to find a way to run functions on any cloud, on servers that I managed, with containers being the primitive, instead of zip files. I wanted to pick a timeout that suited my needs, instead of whatever made sense for the vendor's SLA. I wanted to use containers so that I could deploy and test my work locally.
Perhaps you've tried OpenFaaS, or maybe you just wrote it off because you didn't see a use-case, or felt that you "had to be ready for serverless"? Quite frankly, that's my own fault for doing a poor job of messaging. Let's try to fix that.
OpenFaaS is a platform for running HTTP servers, packaged in containers, with a management API. So we can use it for running our code, and the version of OpenFaaS that we'll explore today can also add stateful services like a Postgresql, MongoDB, Redis, or a Grafana dashboard.
The idea of running a HTTP server for someone was so compelling that Google Cloud released "Cloud Run" in 2018, and if you squint, they look very similar. It's a way to run a HTTP server from a container image, and not much else.
The OpenFaaS stack comes with a few core components - a gateway with a REST management API and built-in Prometheus monitoring and a queue-system built around NATS for running code in the background.
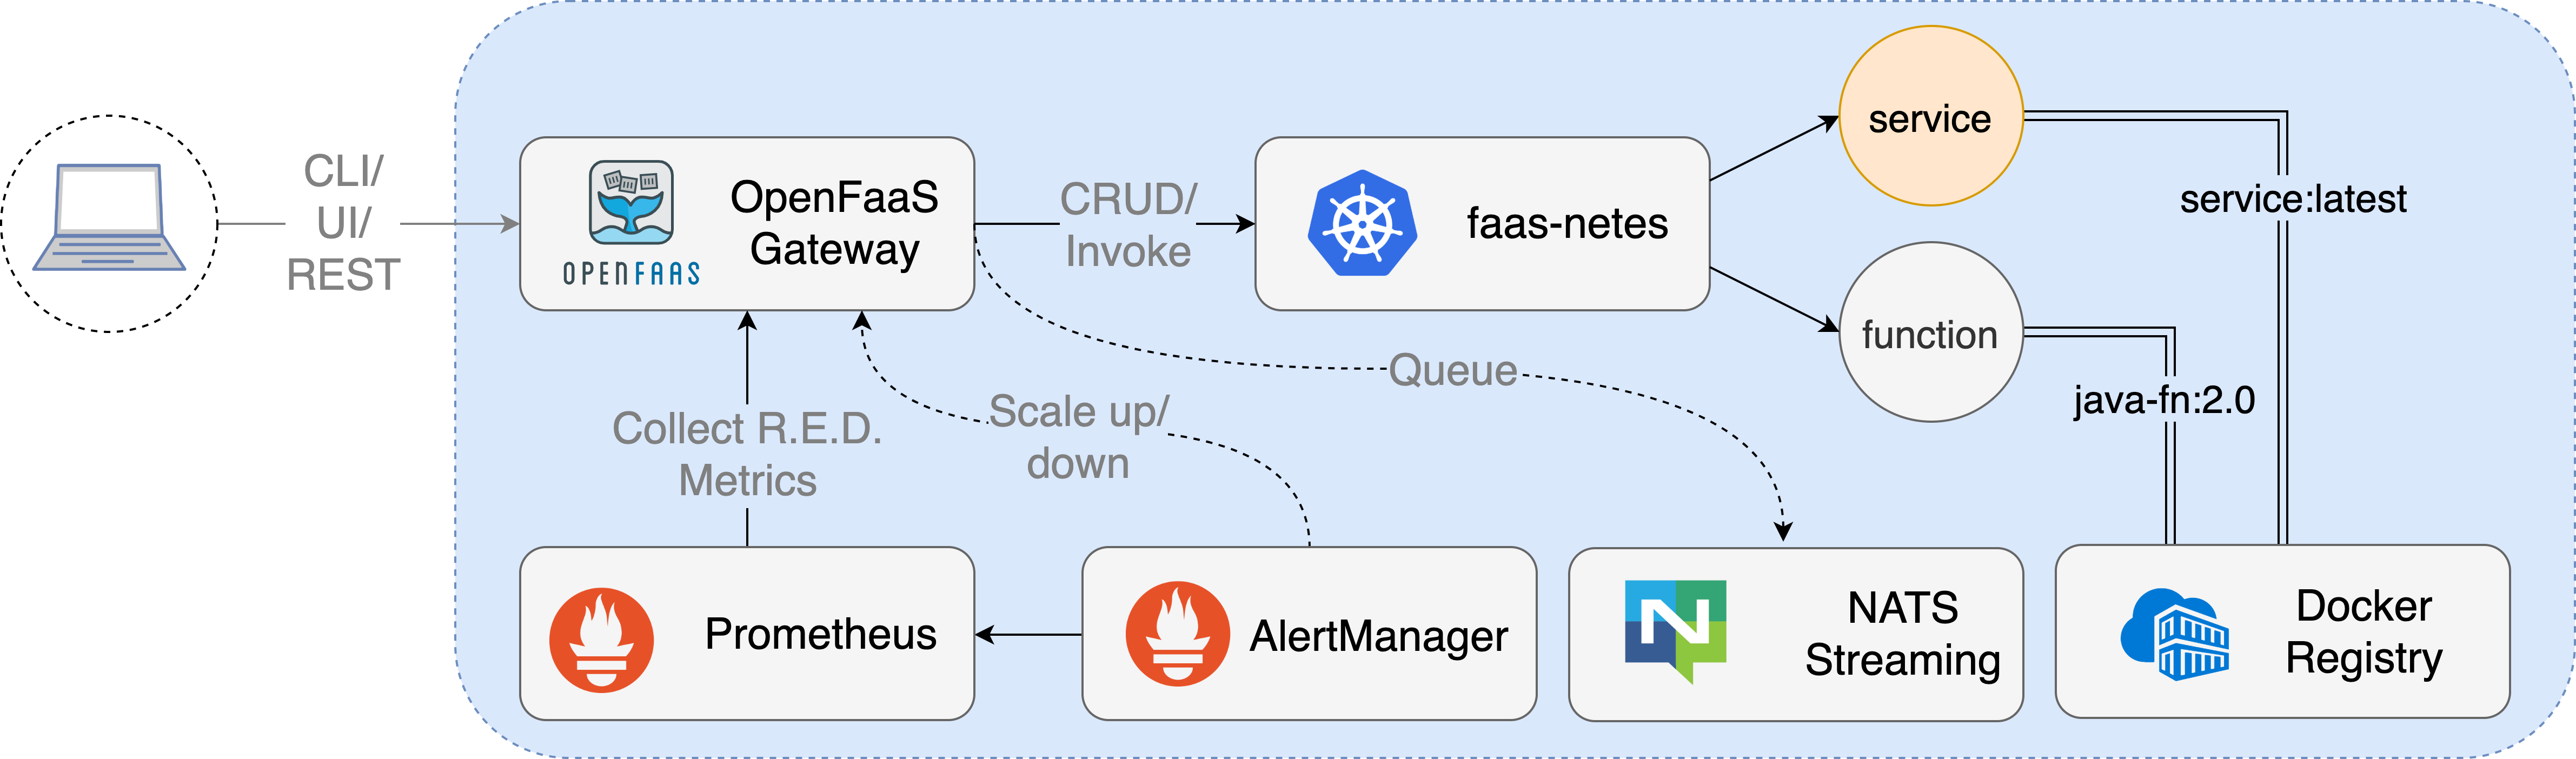
Conceptual overview of OpenFaaS
The templates system takes a lot of the drudgery away from building HTTP services with containers - the Dockerfile gets abstracted way along with the HTTP framework. You get a handler where you fill out your code, and a simple command to package it up.
The function store also provides a quick way to browse pre-made images, like machine learning models and network utilities like nmap, curl, hey or nslookup.
You can access either via:
$ faas-cli template store list

NAME                     SOURCE             DESCRIPTION
csharp                   openfaas           Classic C# template
dockerfile               openfaas           Classic Dockerfile template
go                       openfaas           Classic Golang template
java8                    openfaas           Java 8 template
java11                   openfaas           Java 11 template
java11-vert-x            openfaas           Java 11 Vert.x template
node14                   openfaas           HTTP-based Node 14 template
node12                   openfaas           HTTP-based Node 12 template
node                     openfaas           Classic NodeJS 8 template
php7                     openfaas           Classic PHP 7 template
python                   openfaas           Classic Python 2.7 template
python3                  openfaas           Classic Python 3.6 template
python3-dlrs             intel              Deep Learning Reference Stack v0.4 for ML workloads
ruby                     openfaas           Classic Ruby 2.5 template
ruby-http                openfaas           Ruby 2.4 HTTP template
python27-flask           openfaas           Python 2.7 Flask template
....

$ faas-cli template store pull ruby-http
For functions:
faas-cli store list

FUNCTION                                 DESCRIPTION
NodeInfo                                 Get info about the machine that you'r...
alpine                                   An Alpine Linux shell, set the "fproc...
env                                      Print the environment variables prese...
sleep                                    Simulate a 2s duration or pass an X-S...
shasum                                   Generate a shasum for the given input
Figlet                                   Generate ASCII logos with the figlet CLI
curl                                     Use curl for network diagnostics, pas...
SentimentAnalysis                        Python function provides a rating on ...
hey                                      HTTP load generator, ApacheBench (ab)...
nslookup                                 Query the nameserver for the IP addre...
SSL/TLS cert info                        Returns SSL/TLS certificate informati...
Colorization                             Turn black and white photos to color ...
Inception                                This is a forked version of the work ...
Have I Been Pwned                        The Have I Been Pwned function lets y...
Face Detection with Pigo                 Detect faces in images using the Pigo...
Tesseract OCR                            This function brings OCR - Optical Ch...
...

$ faas-cli store deploy hey
Now, because Kubernetes is too big for our pocket, we'll run a different version of OpenFaaS called "faasd". Where full-size OpenFaaS targets Kubernetes, which eventually, through many layers of indirection, runs your HTTP server in a container, faasd runs your container directly.
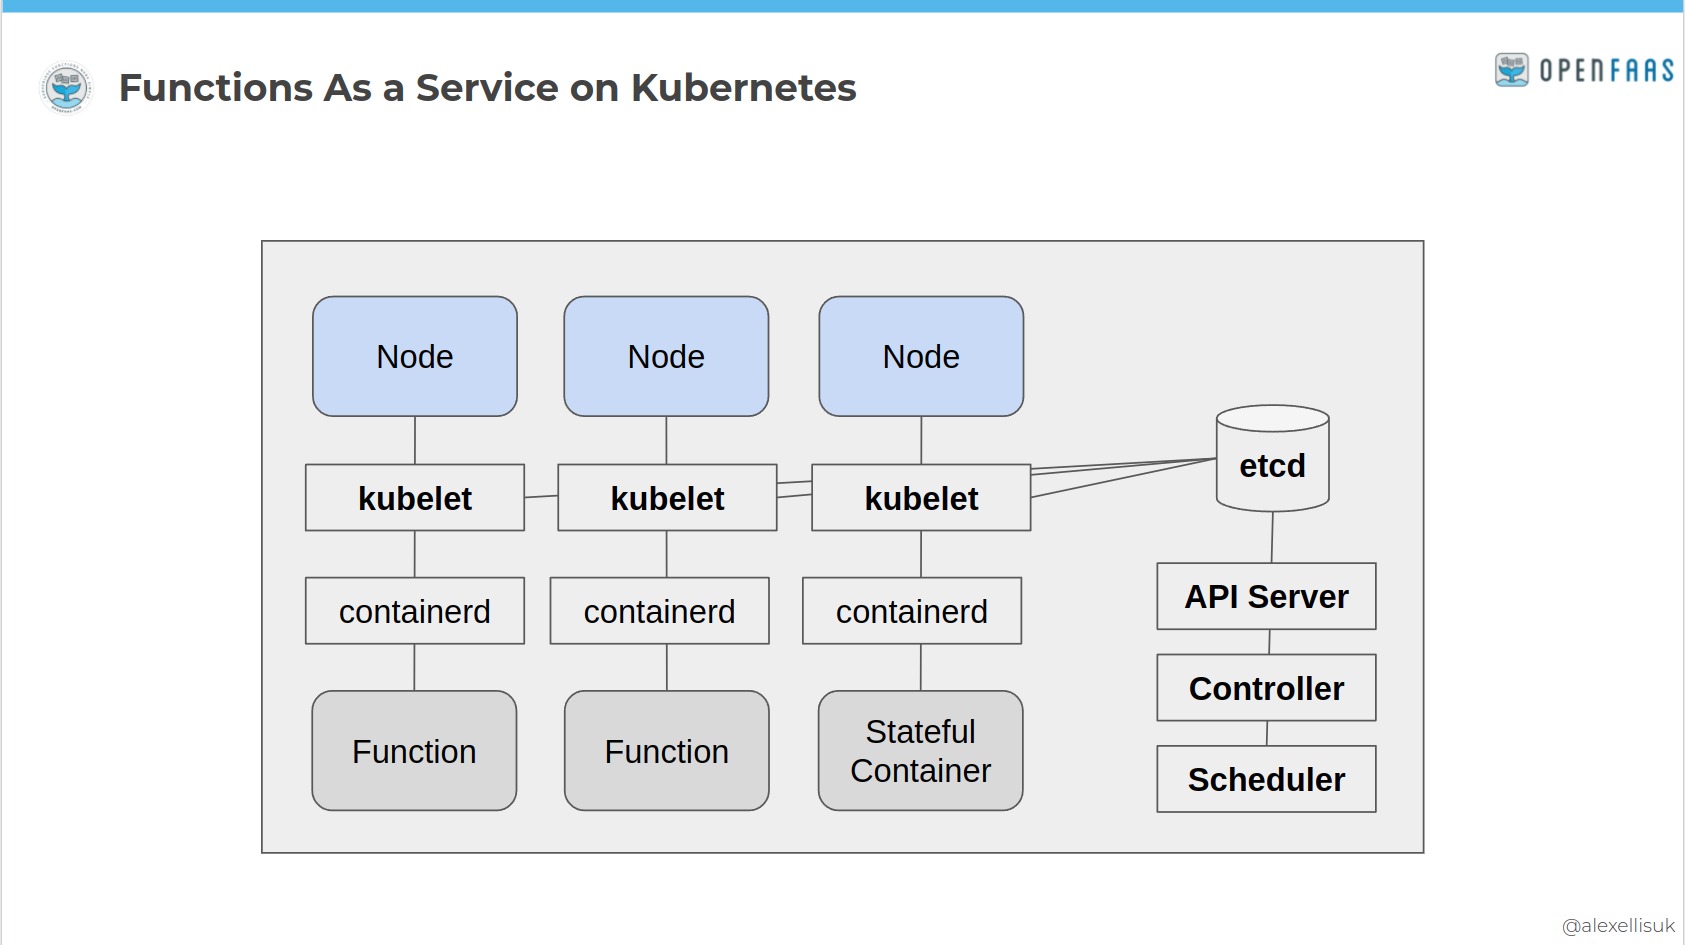
OpenFaaS on Kubernetes
The result of tearing away all those layers is something that remains API-driven, is immensely quick and the learning curve goes down dramatically. It'll no longer be highly-available, clustered, or multi-node, so think of it more like an appliance. Do you have 3 toasters or ovens in your kitchen, just in case one of them fails?
The distance faasd creates from Kubernetes also makes it very stable - there's not much to go wrong, and very few breaking changes or "deprecations" to worry about. Upgrading a faasd appliance is a case of replacing the "faasd" binary and perhaps the containerd binary too.
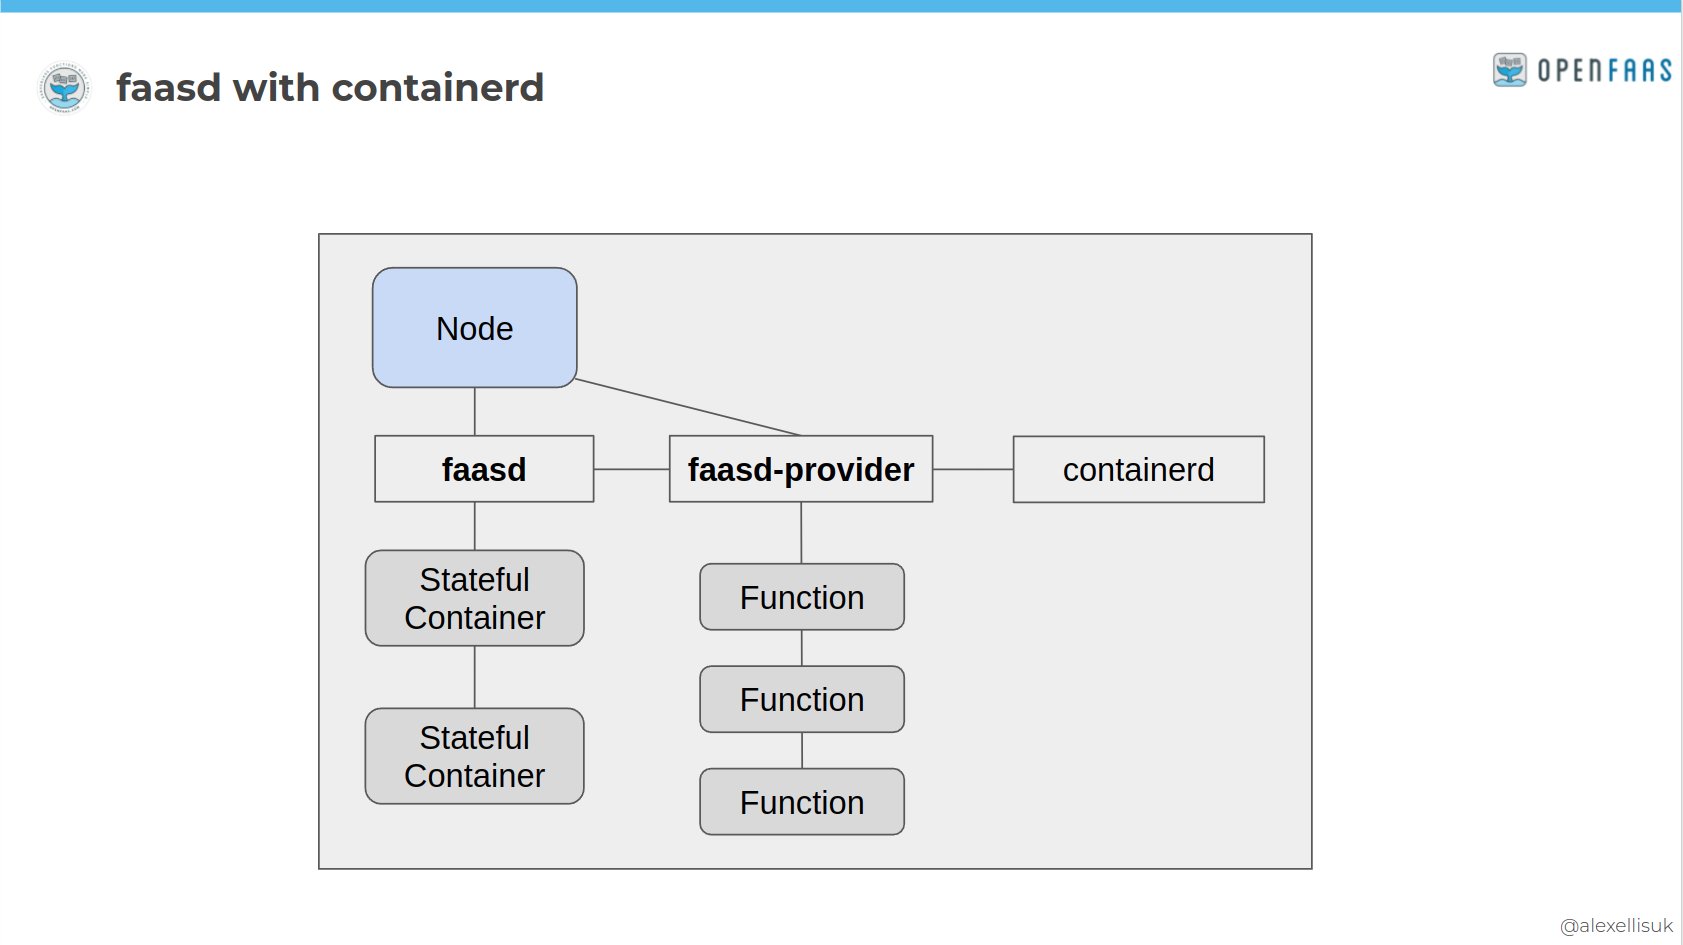
OpenFaaS scheduling containers with faasd and containerd
There are end-users who deploy faasd instead of OpenFaaS on Kubernetes for production. faasd is a great way to deploy code for an internal intranet, client project, or an edge device. Package it as a Virtual Machine, load in your functions and you can pretty much forget about it.
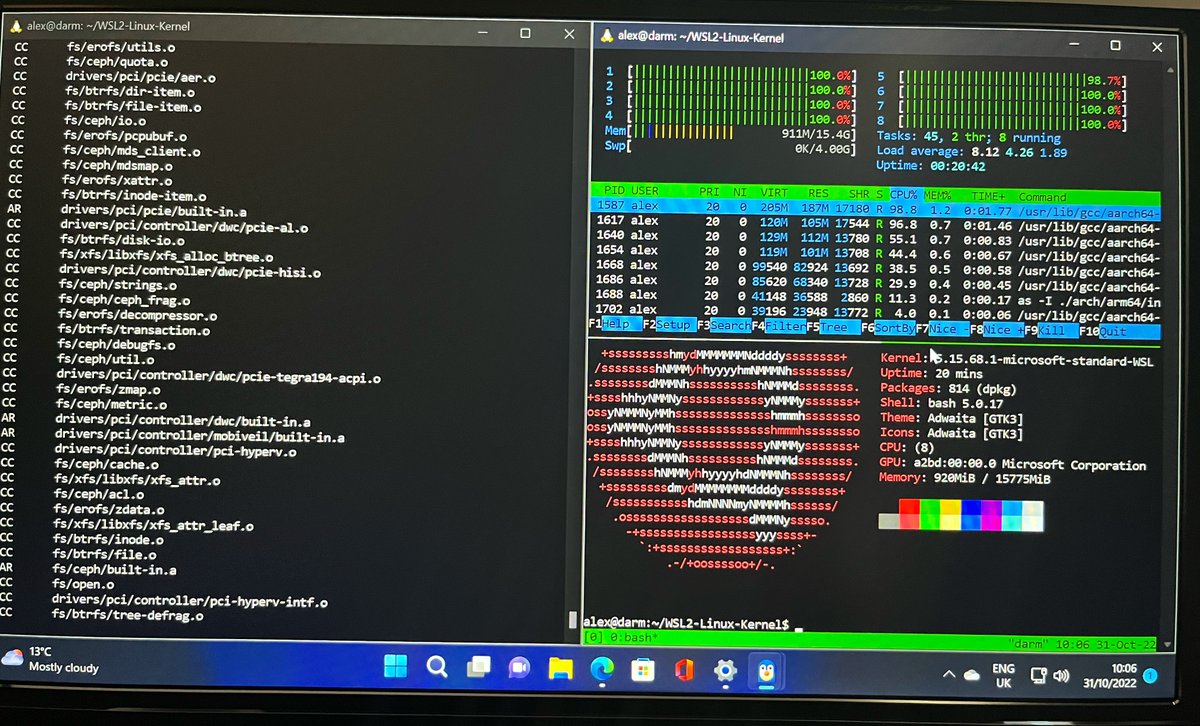
I spoke at Equinix Metal's Proximity event last year on "Getting closer to the metal" (going lower down in the stack, away from Kubernetes). The talk was based around faasd and things we could do that weren't possible with K8s. For instance, we were able to get the cold start to sub-second and schedule 100x more containers on a single node, making it more cost effective.
Dust off that silicon
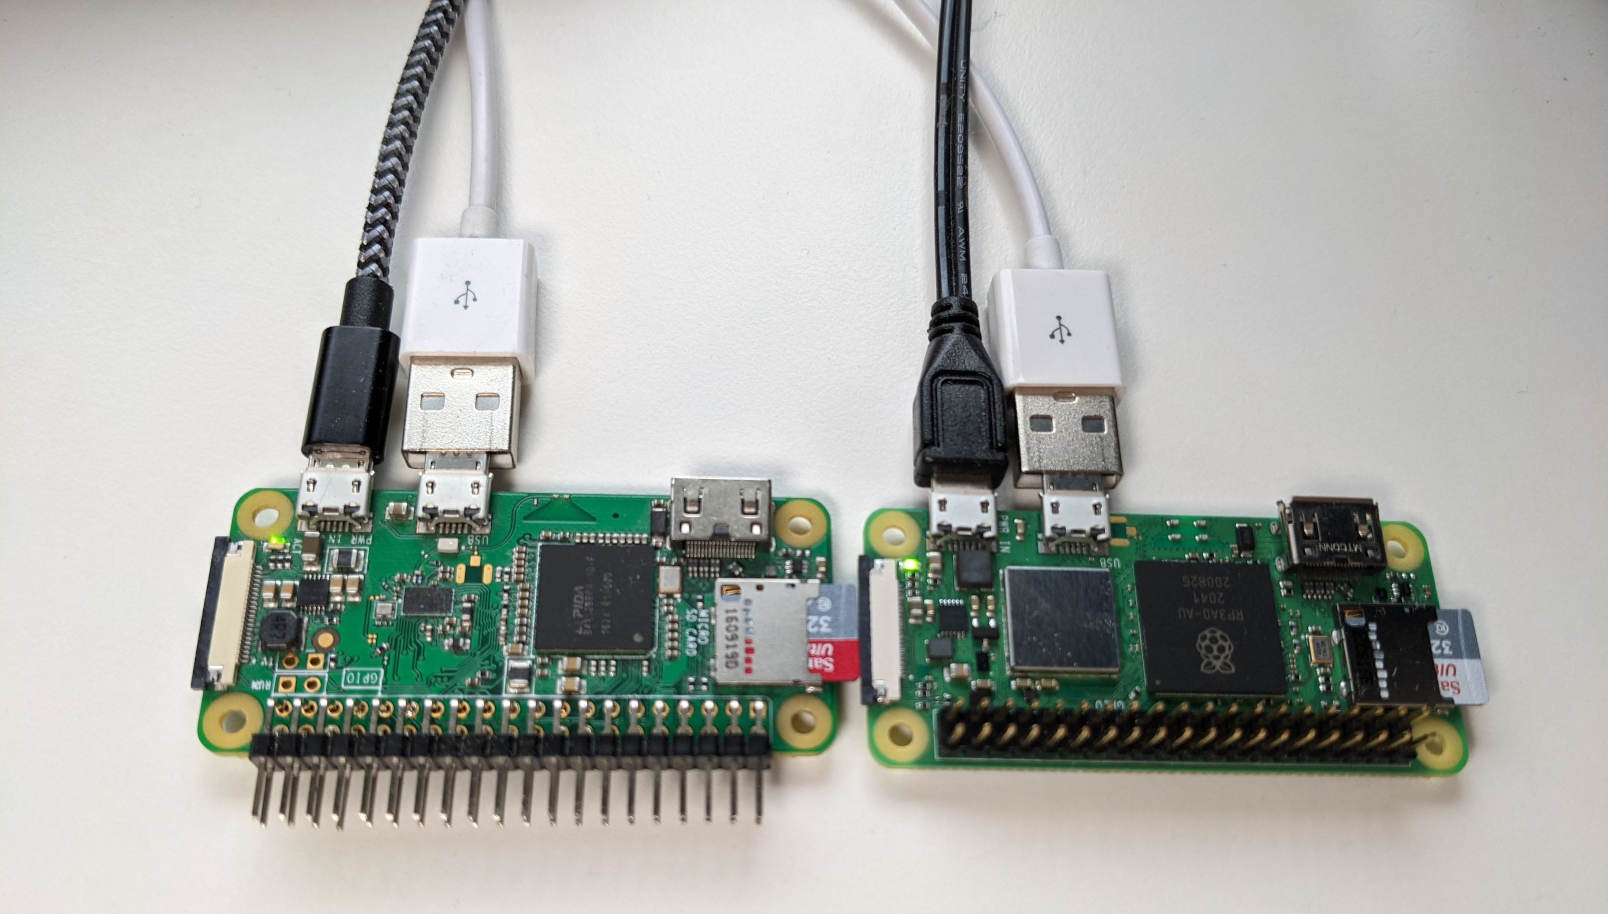
You need at least a Raspberry Pi 3 which has 1GB of RAM for functions or the Raspberry Pi 4, which usually has at least 2GB of RAM available. The Raspberry Pi Zero W 2 will also work, but only has 512MB RAM.
See also: First Impressions with the Raspberry Pi Zero 2 W
I recommend either the "classic" Raspberry Pi 32-bit Operating System Lite edition (Buster) or Ubuntu Server 20.04. Bullseye does work, however there are a few changes in the OS, that you can work around by using Buster.
Flash the image to an SD card using either dd from a Linux host, or a graphical UI like etcher.io. I have a Linux host set aside that I use for flashing SD cards because I do it so often.
Now we are almost ready to boot up and get headless access, without a keyboard or monitor. For the Raspberry Pi OS, you will have to create a file named ssh in the boot partition. For Ubuntu, SSH is already enabled.
Connect to your Raspberry Pi via ssh ssh [email protected] for Raspberry Pi OS, and run nmap -p 22 192.168.0.0/24 if you used Ubuntu, this will show you any new hosts on your network that you can connect to over SSH.
Change the default password and the hostname, for Raspberry Pi OS, use raspi-config
Install faasd
Installing faasd from that SSH session is relatively simple:
git clone https://github.com/openfaas/faasd --depth=1
cd faasd

./hack/install.sh
At the end of the installation, you'll get a command for how to find the password.
Now because our little cloud is API-driven, we should not run any more commands on it directly, but use it as a server from our laptop.
Go over to your workstation and install the OpenFaaS CLI:
# Omit sudo if you wish, then move faas-cli to /usr/local/bin/
curl -SLs https://cli.openfaas.com | sudo sh
Log into your cloud:
export OPENFAAS_URL=http://IP:8080
faas-cli login --password-stdin
Type in the password from the previous session and hit enter.
Try out a function from the store
Now you can deploy a sample function from the function store. This is a blocking command and it may take a few seconds to complete
faas-cli store deploy nodeinfo
Then list your functions, describe it and invoke it:
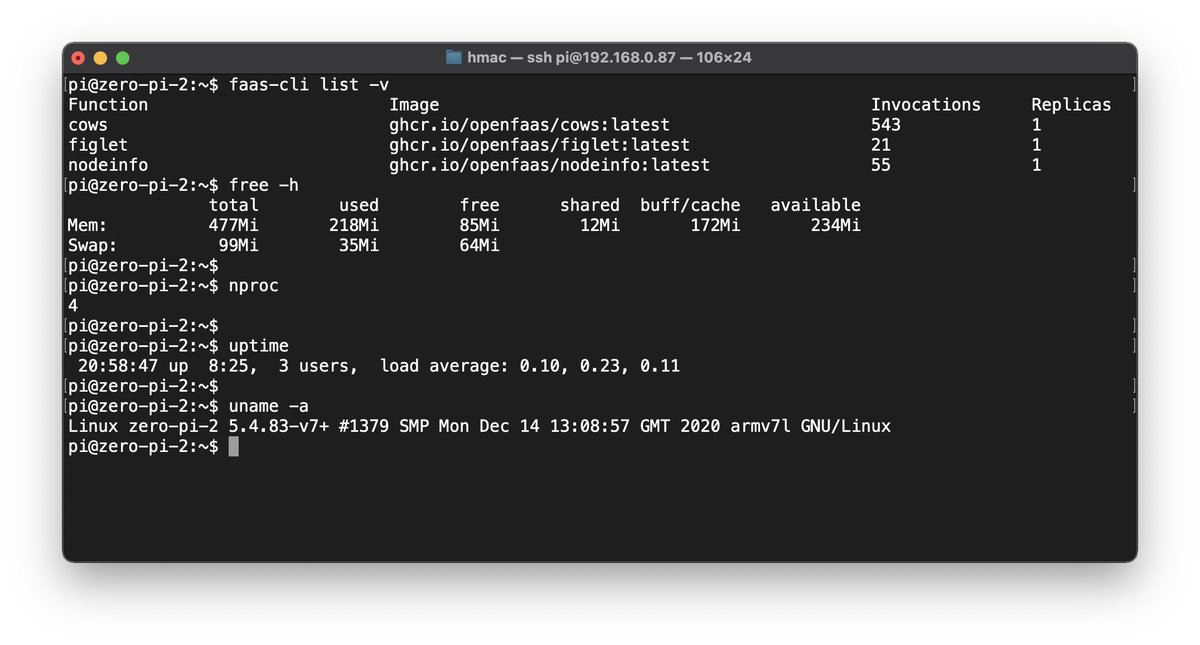
$ faas-cli list -v
Function Image Invocations Replicas
nodeinfo ghcr.io/openfaas/nodeinfo:latest 0 1
$ faas-cli describe nodeinfo
Name: nodeinfo
Status: Ready
Replicas: 1
Available replicas: 1
Invocations: 0
Image:
Function process: node index.js
URL: http://127.0.0.1:8080/function/nodeinfo
Async URL: http://127.0.0.1:8080/async-function/nodeinfo
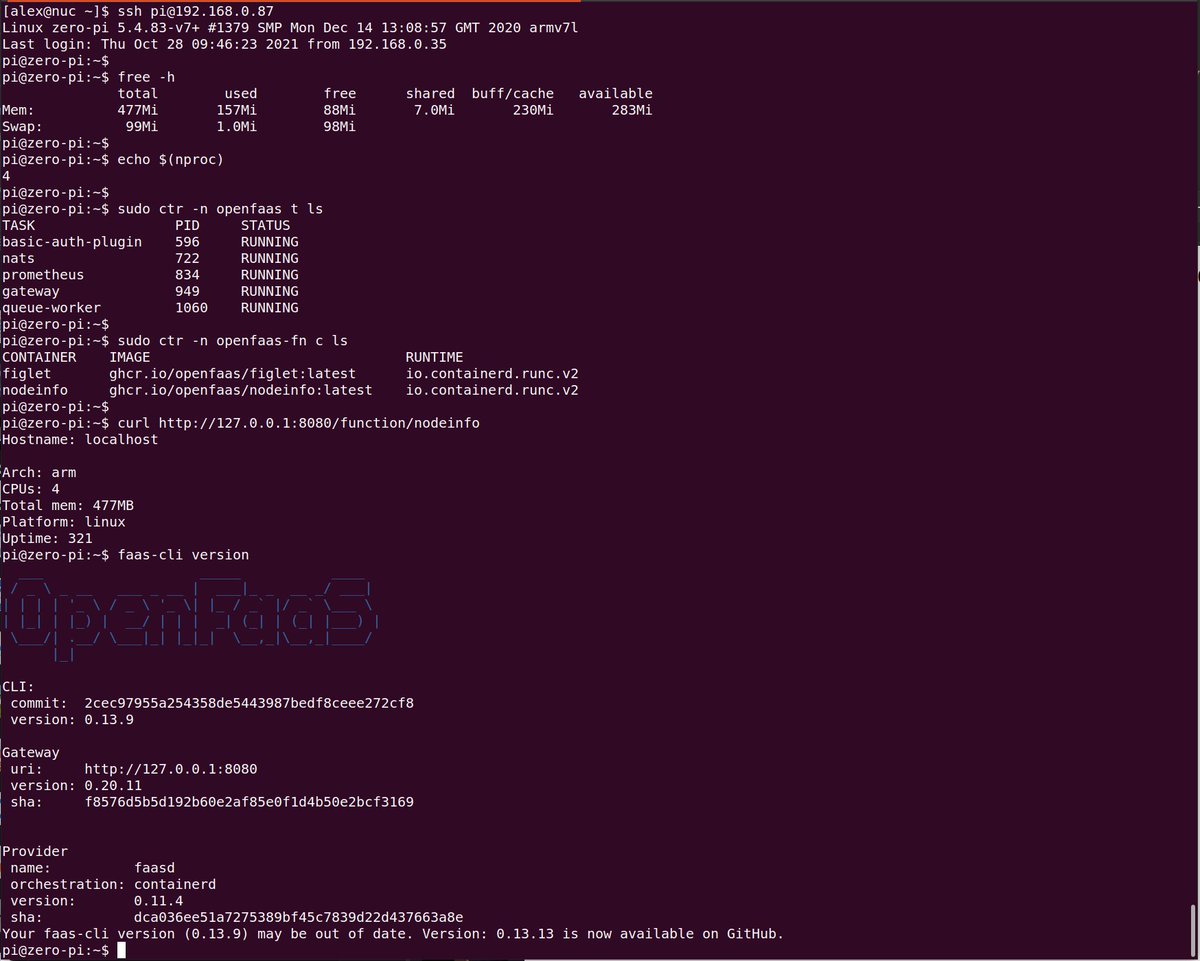
$ curl http://127.0.0.1:8080/function/nodeinfo
Hostname: localhost
Arch: arm
CPUs: 4
Total mem: 476MB
Platform: linux
Uptime: 5319.62
Any function can be invoked asynchronously, which is important for long running functions - scheduled tasks and webhook receivers.
$ curl -d "" -i http://127.0.0.1:8080/async-function/nodeinfo
HTTP/1.1 202 Accepted
X-Call-Id: 9c766581-965a-4a11-9b6d-9c668cfcc388
You'll receive an X-Call-Id that can be used to correlate requests and responses. An X-Callback-Url is optional, and can be used to post the response to a HTTP bin, or some other function that you have, to create a chain.
For instance:
# Netcat running on 192.168.0.68
$ nc -l 8888

$ curl -d "" -H "X-Callback-Url: http://192.168.0.86:8888/" \
    -i http://127.0.0.1:8080/async-function/nodeinfo

HTTP/1.1 202 Accepted
X-Call-Id: 926c4181-6b8e-4a43-ac9e-ec39807b0695
And in netcat, we see:
POST / HTTP/1.1
Host: 192.168.0.86:8888
User-Agent: Go-http-client/1.1
Content-Length: 88
Content-Type: text/plain; charset=utf-8
Date: Wed, 23 Mar 2022 10:44:13 GMT
Etag: W/"58-zeIRnHjAybZGzdgnZVWGeAGymAI"
Keep-Alive: timeout=5
X-Call-Id: 926c4181-6b8e-4a43-ac9e-ec39807b0695
X-Duration-Seconds: 0.086076
X-Function-Name: nodeinfo
X-Function-Status: 200
X-Start-Time: 1648032253651730445
Accept-Encoding: gzip
Connection: close

Hostname: localhost

Arch: arm
CPUs: 4
Total mem: 476MB
Platform: linux
Uptime: 5577.28
Build your own function
You can deploy a predefined HTTP server that listens to requests on port 8080, use a custom Dockerfile, or an openfaas template from the store.
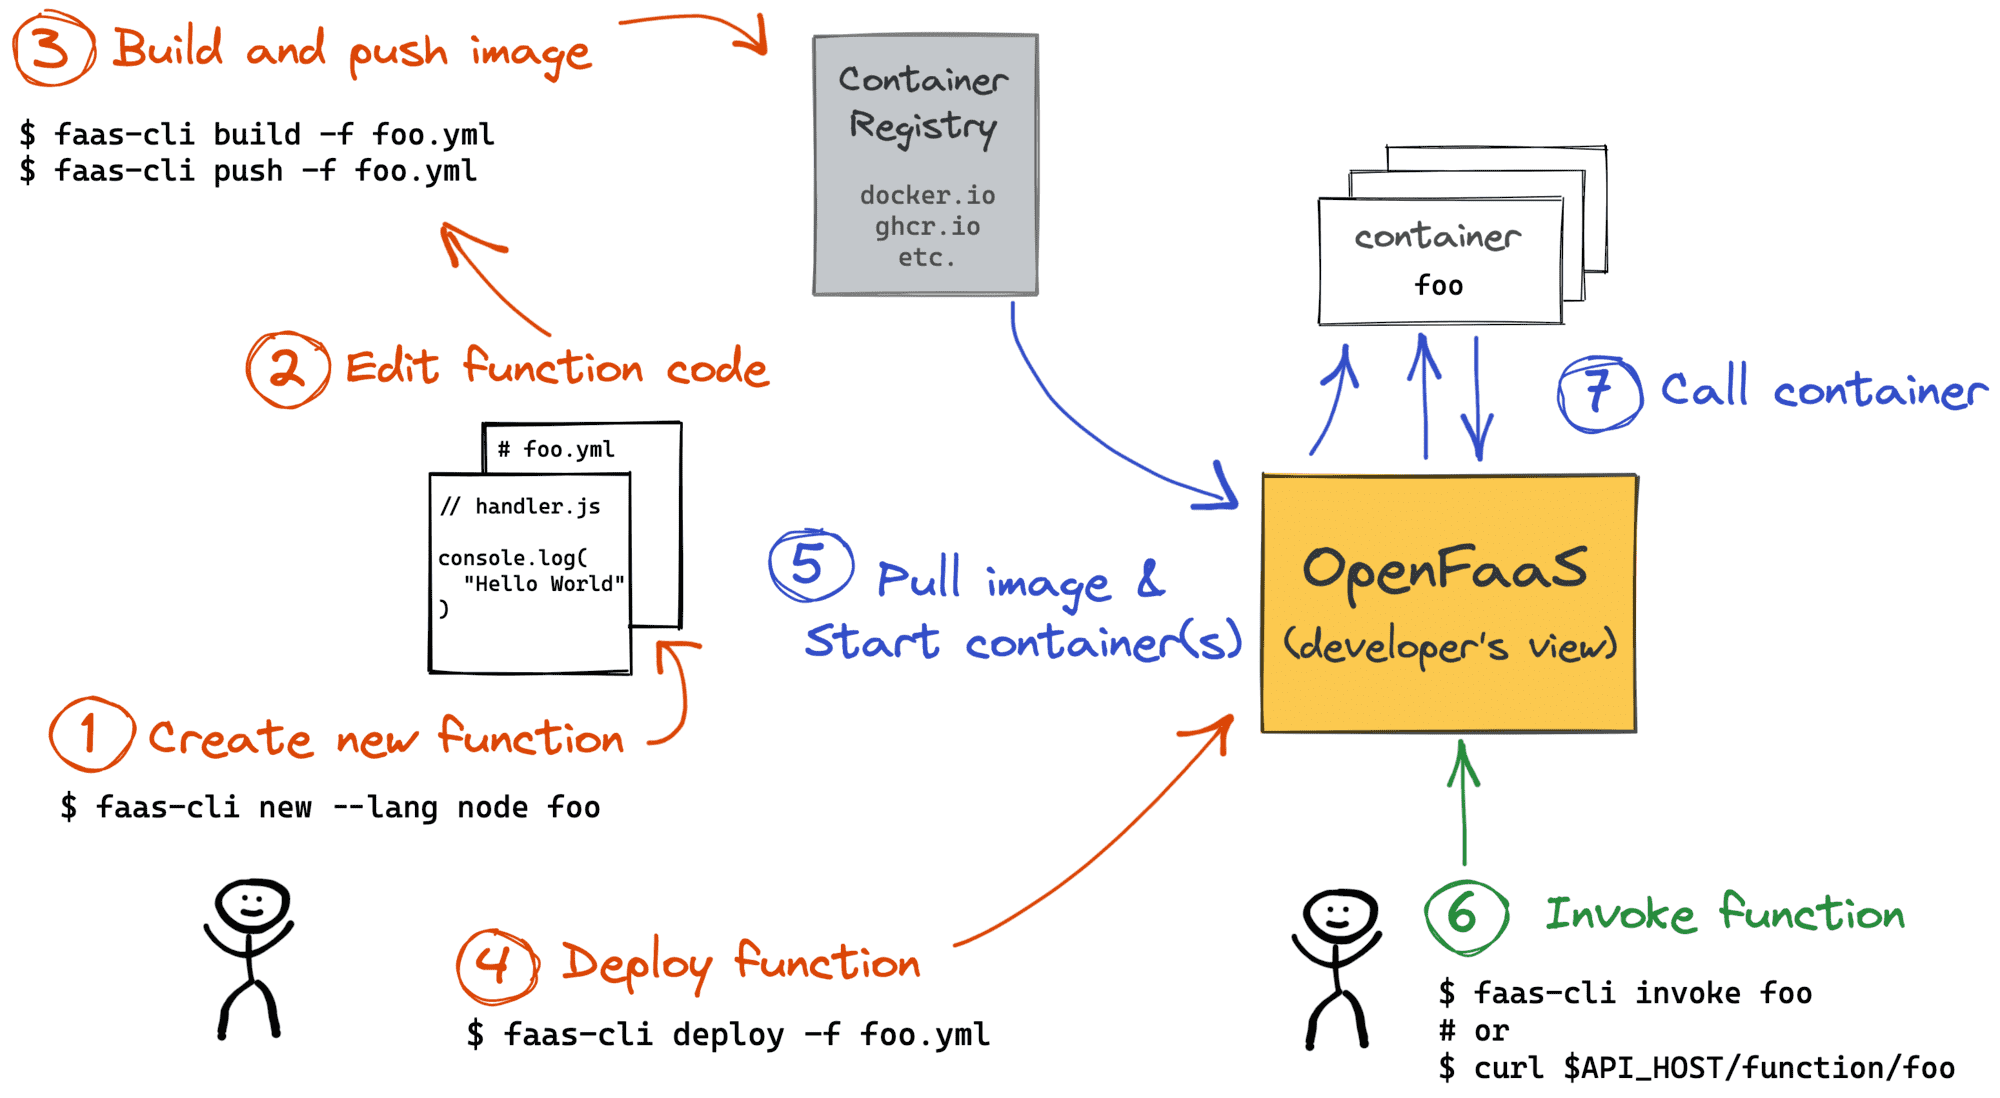
Building and Deploying Functions, credit: Ivan Velichko
Create a function called "mystars" - we'll use it to receive webhooks from GitHub when someone stars one of our repos:
export OPENFAAS_PREFIX="ghcr.io/alexellis"
faas-cli new --lang node16 mystars
This creates:
mystars.yml
mystars/handler.js
mystars/handler.json
The mystars.yml defines how to build and deploy the function.
The mystars/handler.js defines what to do in response to a HTTP request.
'use strict'

module.exports = async (event, context) => {
  const result = {
    'body': JSON.stringify(event.body),
    'content-type': event.headers["content-type"]
  }

  return context
    .status(200)
    .succeed(result)
}
This is very similar to AWS Lambda, and you can find the full documentation in the eBook Serverles For Everyone Else, and a more limited overview in the docs at: Node.js templates (of-watchdog template)
Then you can install any NPM modules you may need like octokit by running cd mystars and run npm install --save
To try out the function on your Raspberry Pi, build it on your own host, using Docker, publish the image to your GHCR account and then deploy it.
faas-cli publish -f mystars.yml \
  --platforms linux/amd64,linux/arm64,linux/arm/7
You can remove the other platforms if you want quicker builds, but the above cross-compiles your function to run on a 32-bit ARM OS, 64-bit OS like Ubuntu and a PC like your workstation/laptop or a regular cloud server.
Once published, deploy the function with:
faas-cli deploy -f mystars.yml
Finally, you can invoke your function synchronously, or asynchronously just like we did earlier with the nodeinfo function.
Want more code examples?
There's also plenty of blog posts on the OpenFaaS site on using Python, Java, C#, existing Dockerfiles etc.
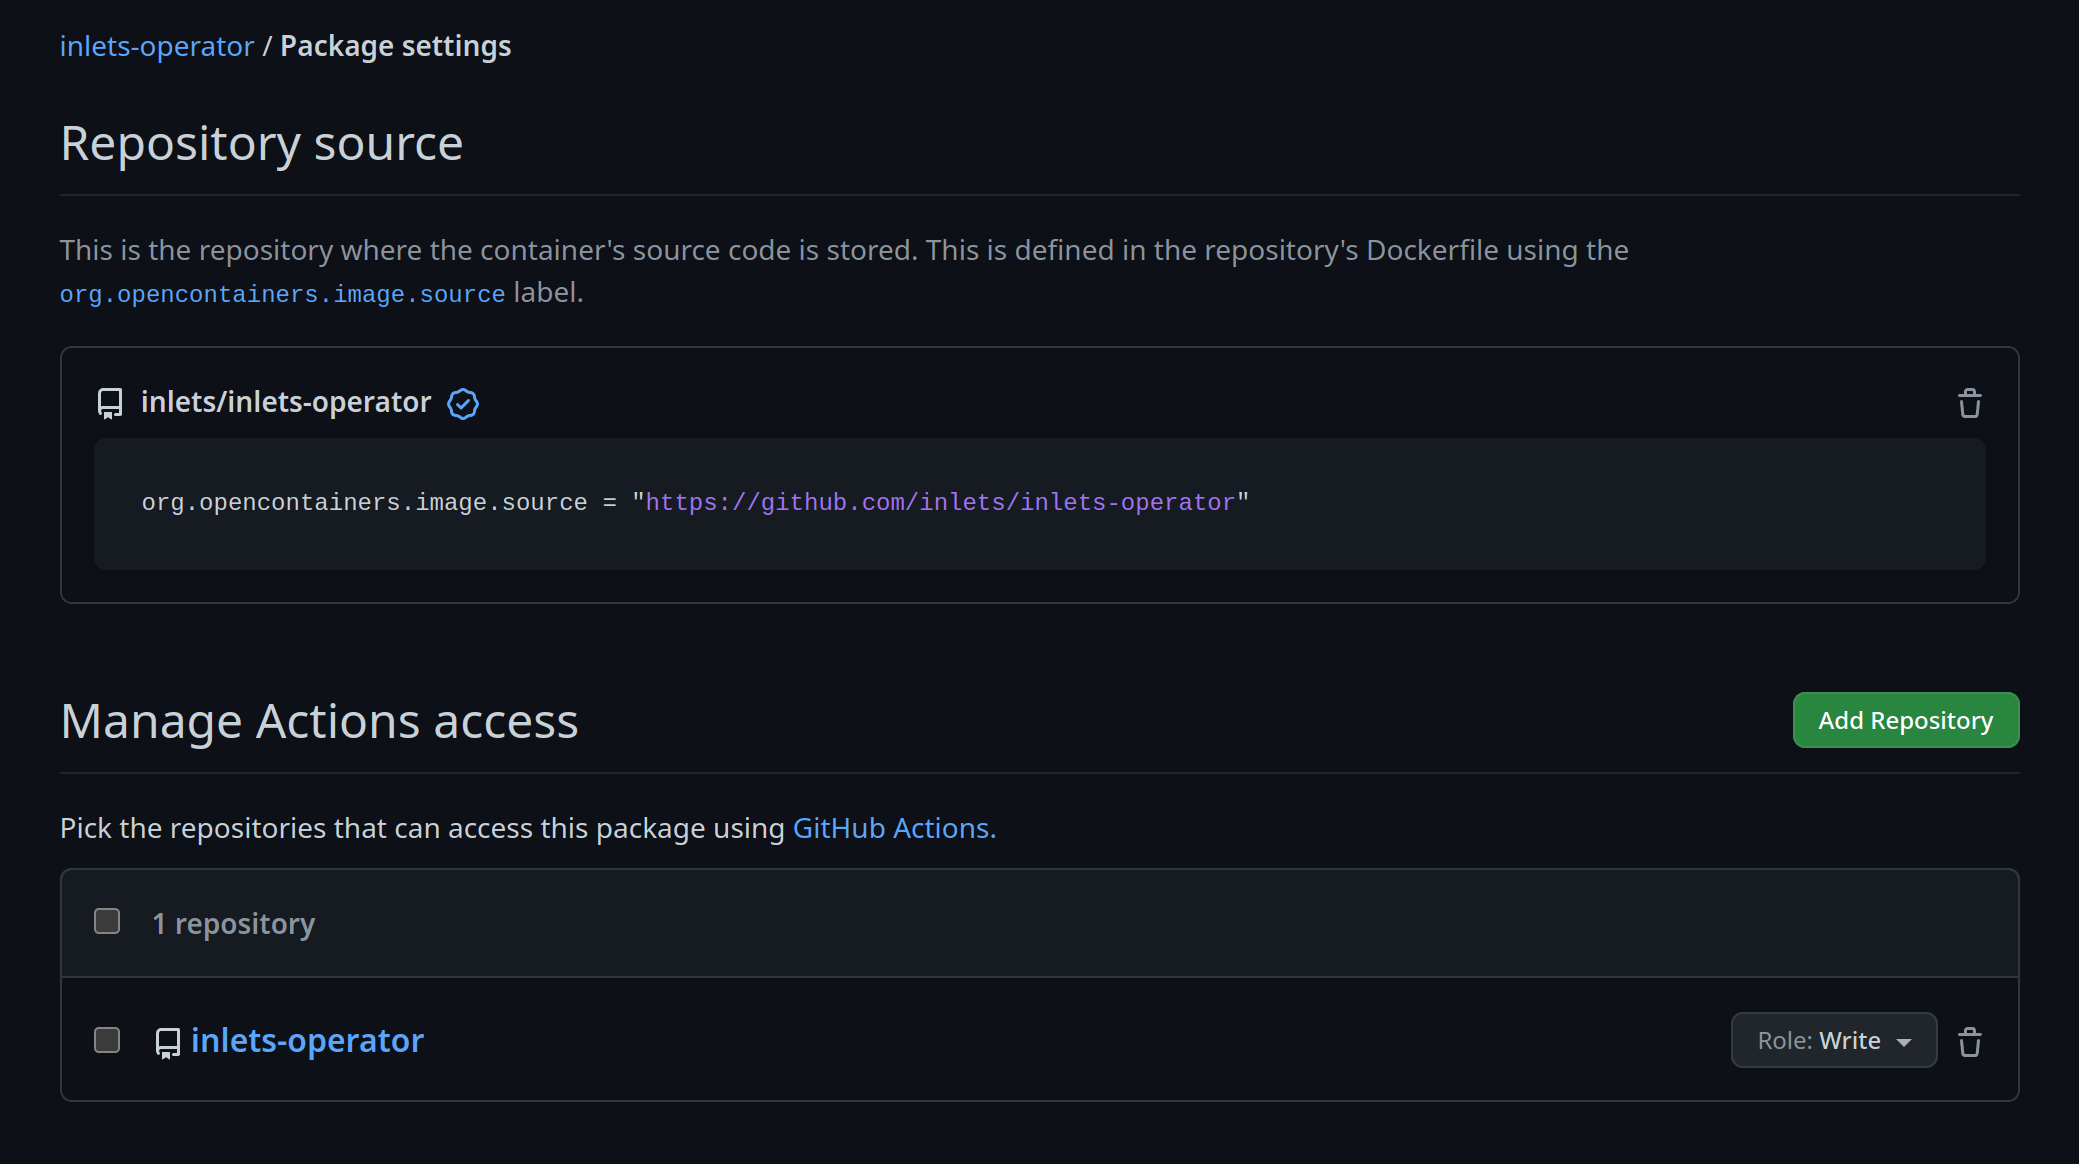
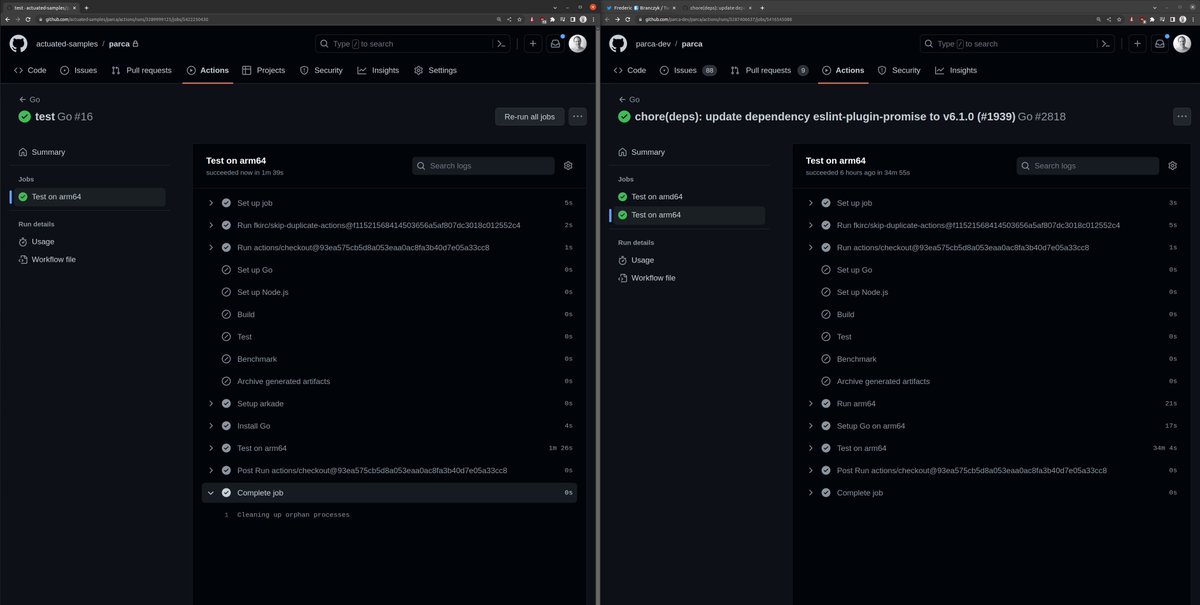
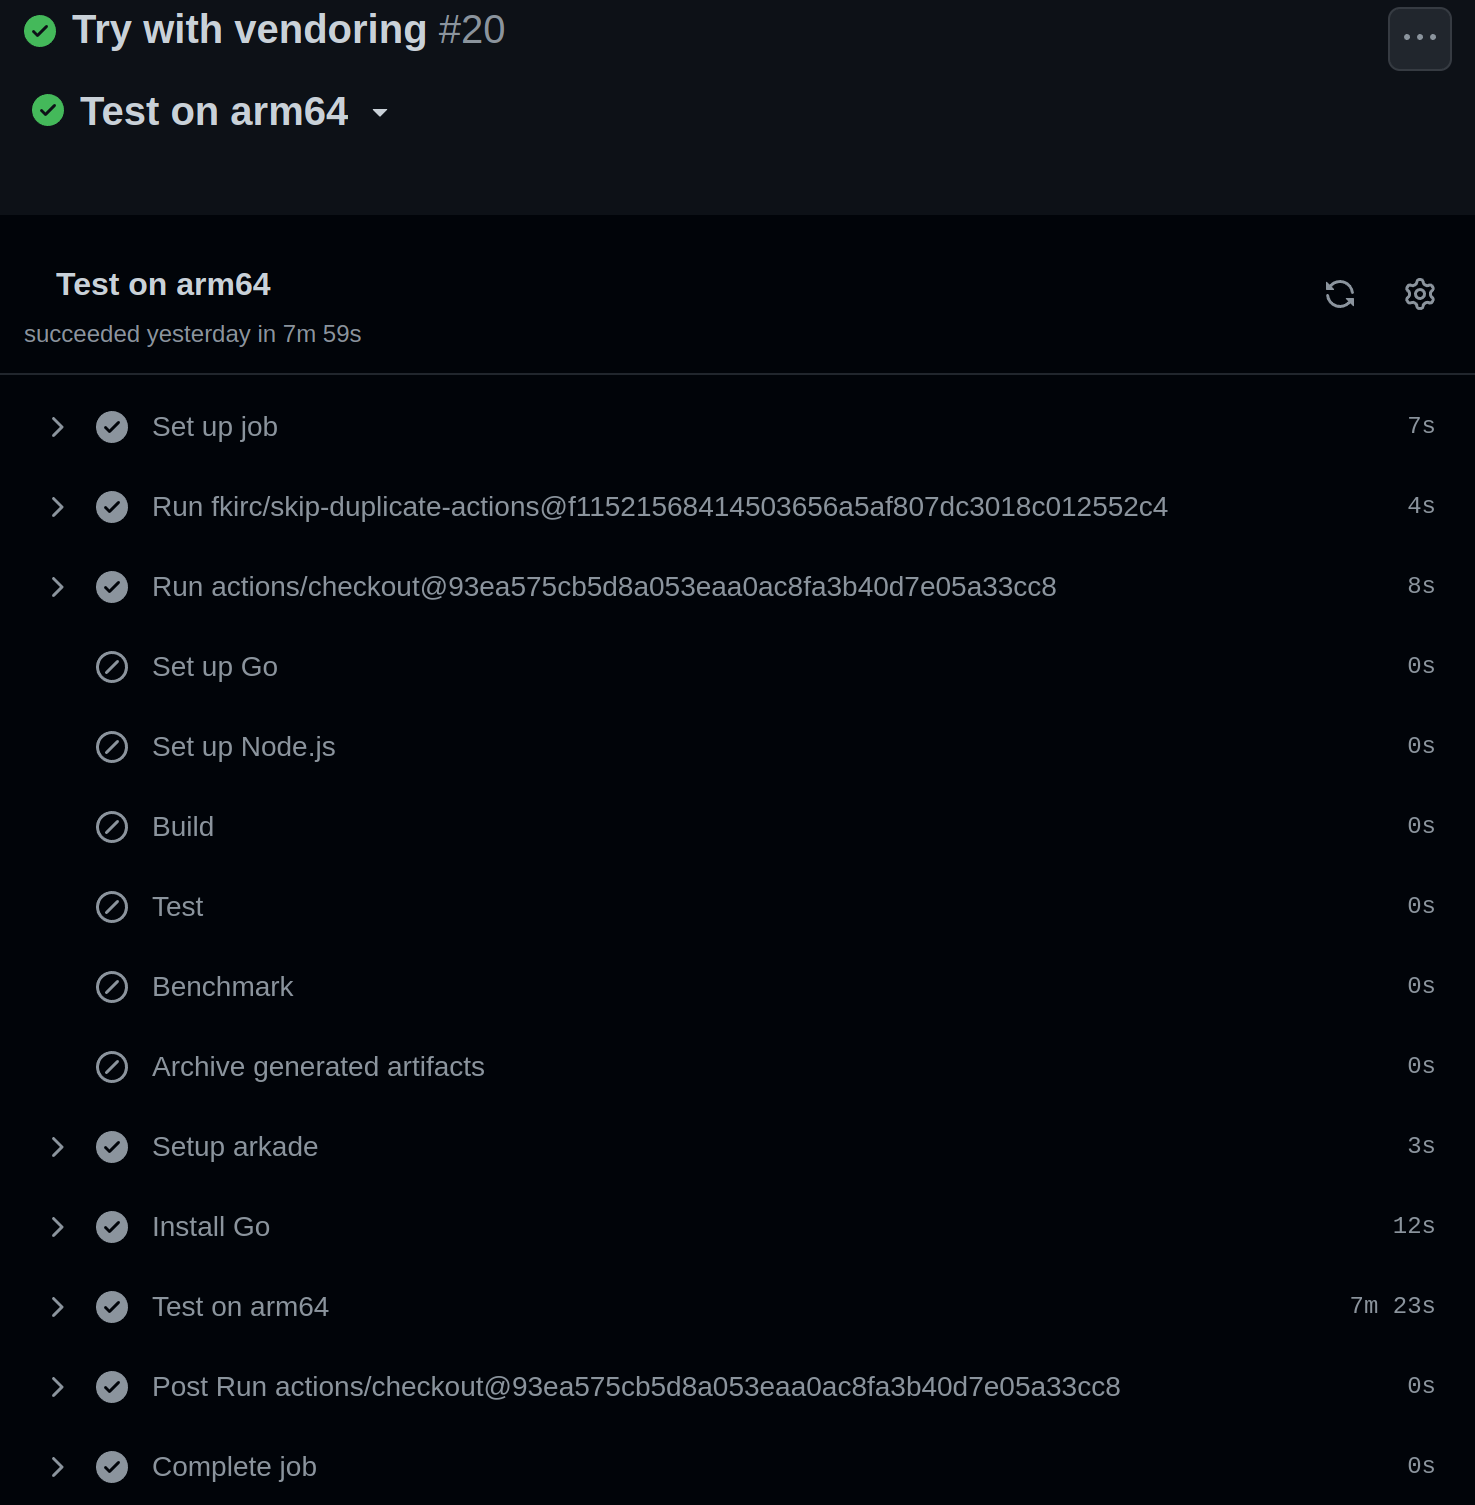
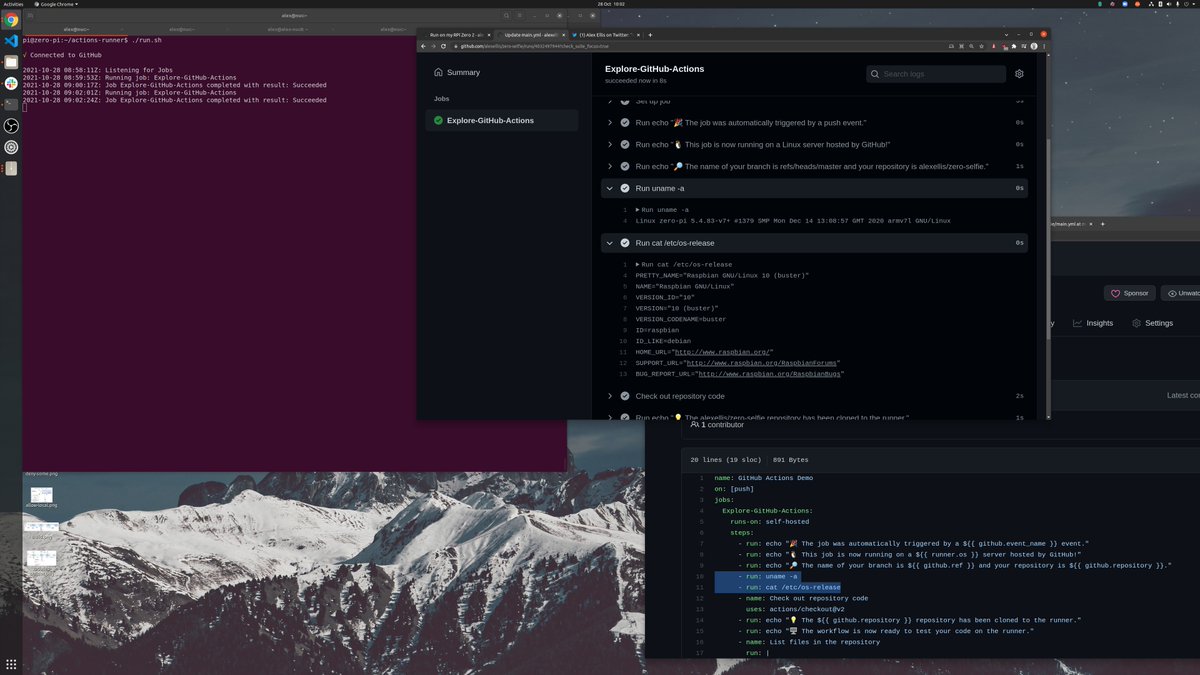
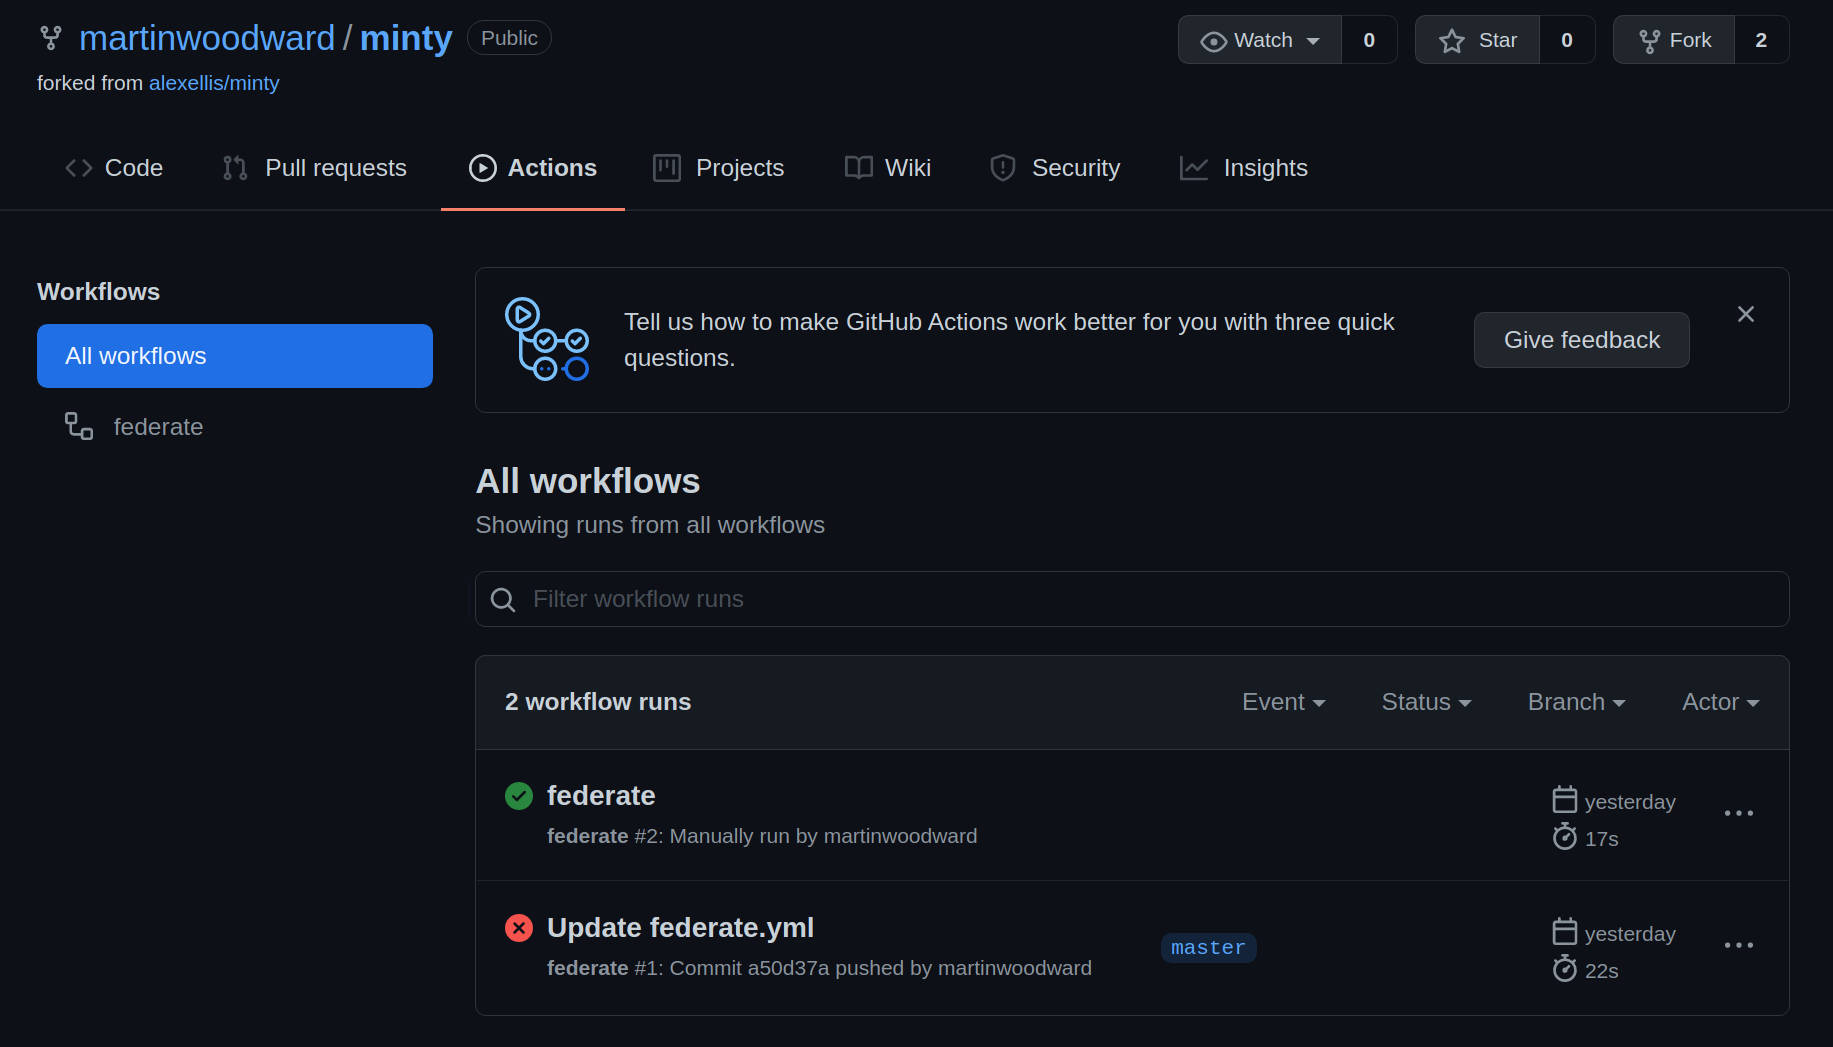
CI/CD with GitHub Actions
For a pocket-sized cloud, we want to do as much automation as possible, which includes building our images, and deploying them. My favourite solution is GitHub Actions, but you can use similar techniques with whatever you're most familiar with.
GitHub Actions, plus GitHub's Container Registry ghcr.io make a perfect combination for our functions. Any public repos and images are free to build, store and deploy later on.
In a simple pipeline, we can install the faas-cli, pull down the templates we need and publish our container images.
I've separated out the build from the deployment, but you could combine them too.
Rather than using mystars.yml, rename the file to stack.yml, so that we have one less thing to configure in our build.
name: build

on:
  push:
    branches:
      - '*'
  pull_request:
    branches:
      - '*'

permissions:
  actions: read
  checks: write
  contents: read
  packages: write

jobs:
  build:
    runs-on: ubuntu-latest
    steps:
      - uses: actions/checkout@master
        with:
          fetch-depth: 1
      - name: Get faas-cli
        run: curl -sLSf https://cli.openfaas.com | sudo sh
      - name: Set up QEMU
        uses: docker/setup-qemu-action@v1
      - name: Set up Docker Buildx
        uses: docker/setup-buildx-action@v1
      - name: Get TAG
        id: get_tag
        run: echo ::set-output name=TAG::latest-dev
      - name: Get Repo Owner
        id: get_repo_owner
        run: >
          echo ::set-output name=repo_owner::$(echo $ |
          tr '[:upper:]' '[:lower:]')
      - name: Login to Container Registry
        uses: docker/login-action@v1
        with:
          username: $
          password: $
          registry: ghcr.io
      - name: Publish functions
        run: >
          OWNER="$"
          TAG="latest"
          faas-cli publish
          --extra-tag $
          --platforms linux/arm/v7
In order to replace the default tag of "latest" for your container image in stack.yml, and change the field: image: ghcr.io/alexellis/mystars:latest to image: ghcr.io/alexellis/mystars:${TAG:-latest}.
This next part deploys the function. It runs whenever I create a release in the GitHub repo, and will deploy the latest image using the SHA pushed to GHCR.
name: publish

on:
  push:
    tags:
      - '*'

permissions:
  actions: read
  checks: write
  contents: read
  packages: read

jobs:
  publish:
    runs-on: ubuntu-latest
    steps:
      - uses: actions/checkout@master
        with:
          fetch-depth: 1
      - name: Get faas-cli
        run: curl -sLSf https://cli.openfaas.com | sudo sh
      - name: Pull template definitions
        run: faas-cli template pull
      - name: Get TAG
        id: get_tag
        run: echo ::set-output name=TAG::latest-dev
      - name: Get Repo Owner
        id: get_repo_owner
        run: >
          echo ::set-output name=repo_owner::$(echo $ |
          tr '[:upper:]' '[:lower:]')
      - name: Login to Container Registry
        uses: docker/login-action@v1
        with:
          username: $
          password: $
          registry: ghcr.io
      - name: Login
        run: >
          echo $ |
          faas-cli login --gateway $ --password-stdin
      - name: Deploy
        run: >
          OWNER="$"
          TAG="$"
          faas-cli deploy --gateway $
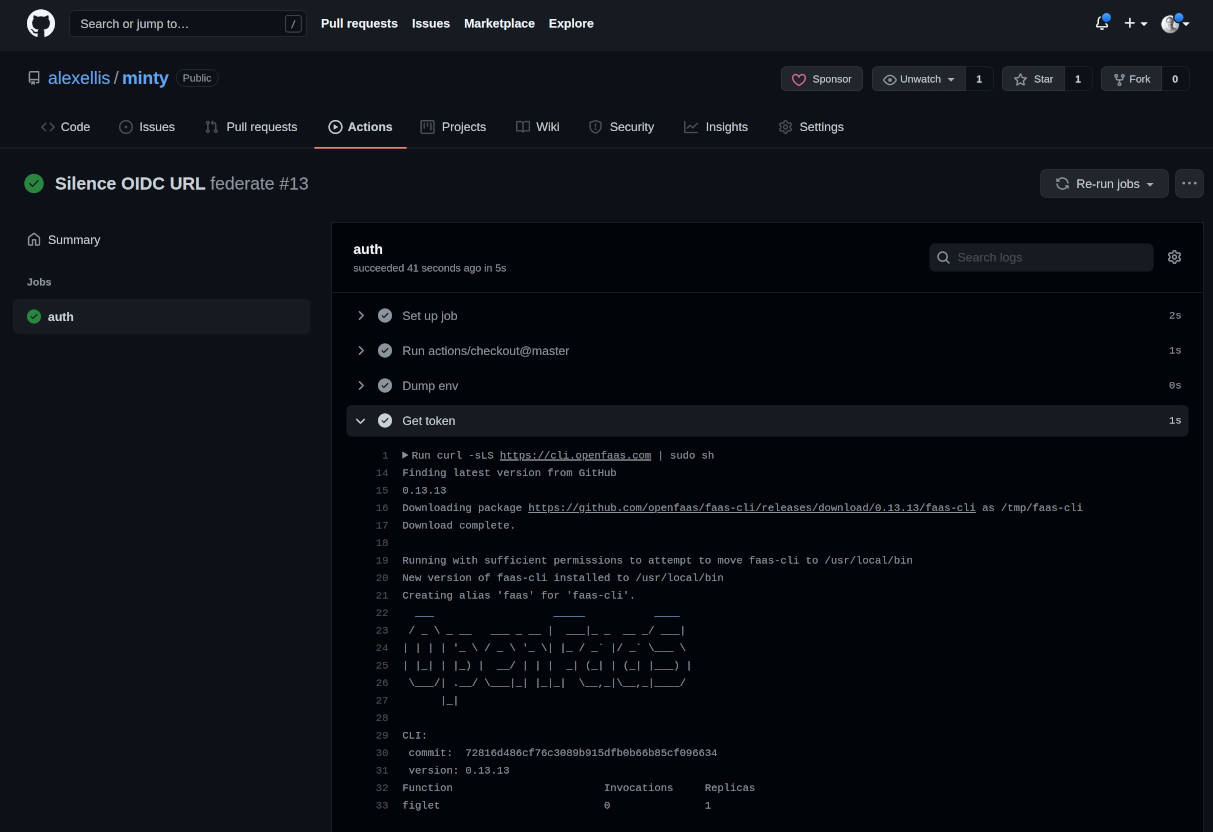
The final part - the deployment can be made over an inlets HTTPS tunnel.
Your inlets URL can be configured via a secret called OPENFAAS_URL along with your password for the OpenFaaS API in OPENFAAS_PASSWORD.
For more on inlets see:
The above examples are from Serverless For Everyone Else, you can see the example repo here: alexellis/faasd-example
Triggering your functions
If you set up an inlets tunnel, then you'll have a HTTPS URL for the OpenFaaS API, and potentially a number of custom domains for your functions on top of that.
For instance, with my Treasure Trove function the insiders.alexellis.io domain maps to http://127.0.0.1:8080/function/trove in OpenFaaS.
So you can provide a URL to an external system for incoming webhooks - from Stripe, PayPal, GitHub, Strava, etc or you can share the URL of your custom domain, like I did with the Treasure Trove. In the example I mentioned above, I provided a URL to IFTTT, to send tweets in JSON format, which are then filtered before being sent off to a Discord channel.
It's up to you whether you want to use the synchronous or asynchronous URL. If your function is slow, then the originating system may retry the message, in that instance, the asynchronous URL would be better.
The UI is served on port 8080, but can be put behind a TLS-terminating reverse proxy like Caddy or Nginx.

Trying out the OpenFaaS UI
After HTTP, the second most popular way to invoke a function is via a cron schedule.
Imagine that you had a function that ran every 5 minutes, to send out password reset emails, after having queried a database for pending rows.
It might look a bit like this:
version: 1.0
provider:
  name: openfaas
  gateway: http://127.0.0.1:8080
functions:
  mystars:
    lang: node16
    handler: ./mystars
    image: ghcr.io/alexellis/send-password-resets:latest
    topic: cron-function
    schedule: "*/5 * * * *"
    secrets:
    - aws-sqs-secret-key
    - aws-sqs-secret-token
    - postgresql-username
    - postgresql-password
    environment:
      db_name: resets
In addition to the code, you can supply a number of secrets and environment variables to configure the function.
You can add stateful containers to faasd by editing its docker-compose.yaml file. Don't be confused by that name, Docker and Compose are not used in faasd, but we do use the same familiar spec to define what to run.
Here's how we add NATS, with a bind-mount so that its data is kept between reboots or restarts:
  nats:
    image: docker.io/library/nats-streaming:0.22.0
    user: "65534"
    command:
      - "/nats-streaming-server"
      - "-m"
      - "8222"
      - "--store=file"
      - "--dir=/nats"
      - "--cluster_id=faas-cluster"
    volumes:
      - type: bind
        source: ./nats
        target: /nats
You can learn how to configure cron schedules, stateful services, secrets and environment variables in Serverless For Everyone Else.
Monitoring
OpenFaaS emits metrics in Prometheus format for its own API and any functions that you invoke through the OpenFaaS gateway.
Browse the metrics in the docs: OpenFaaS Metrics
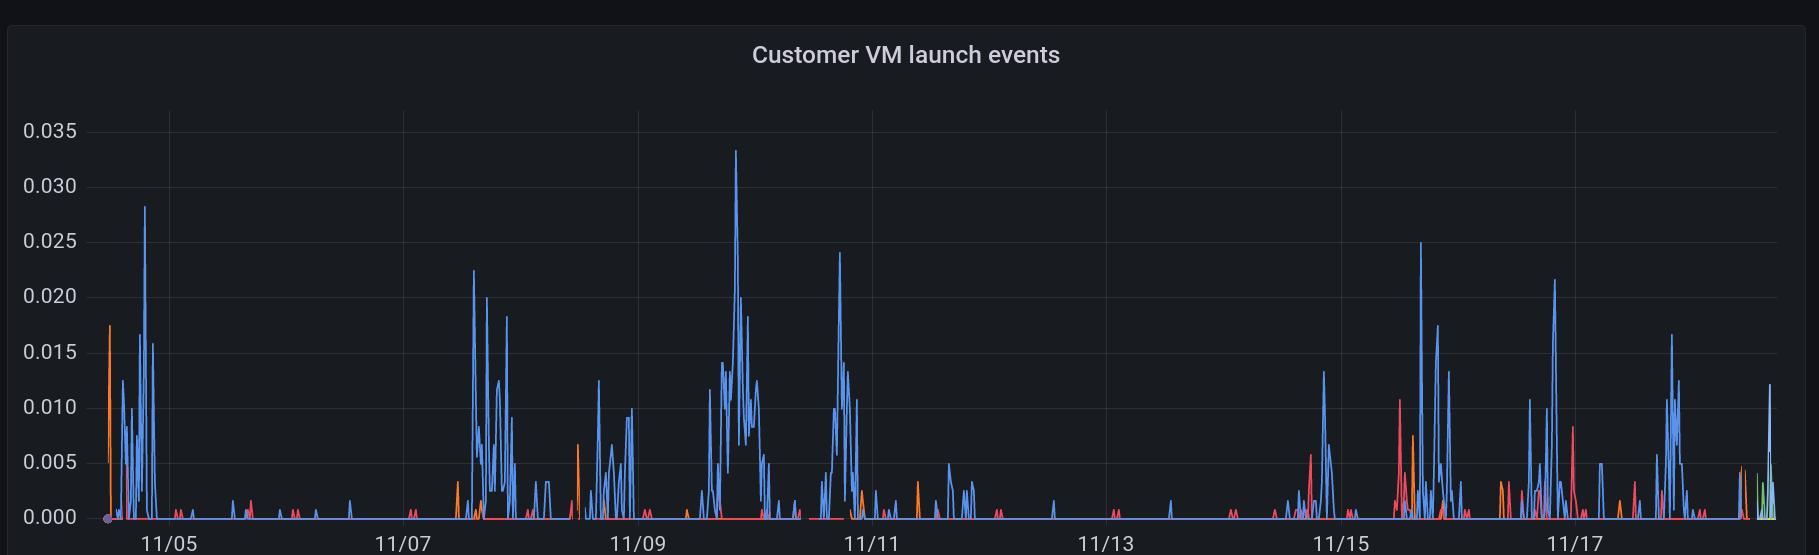
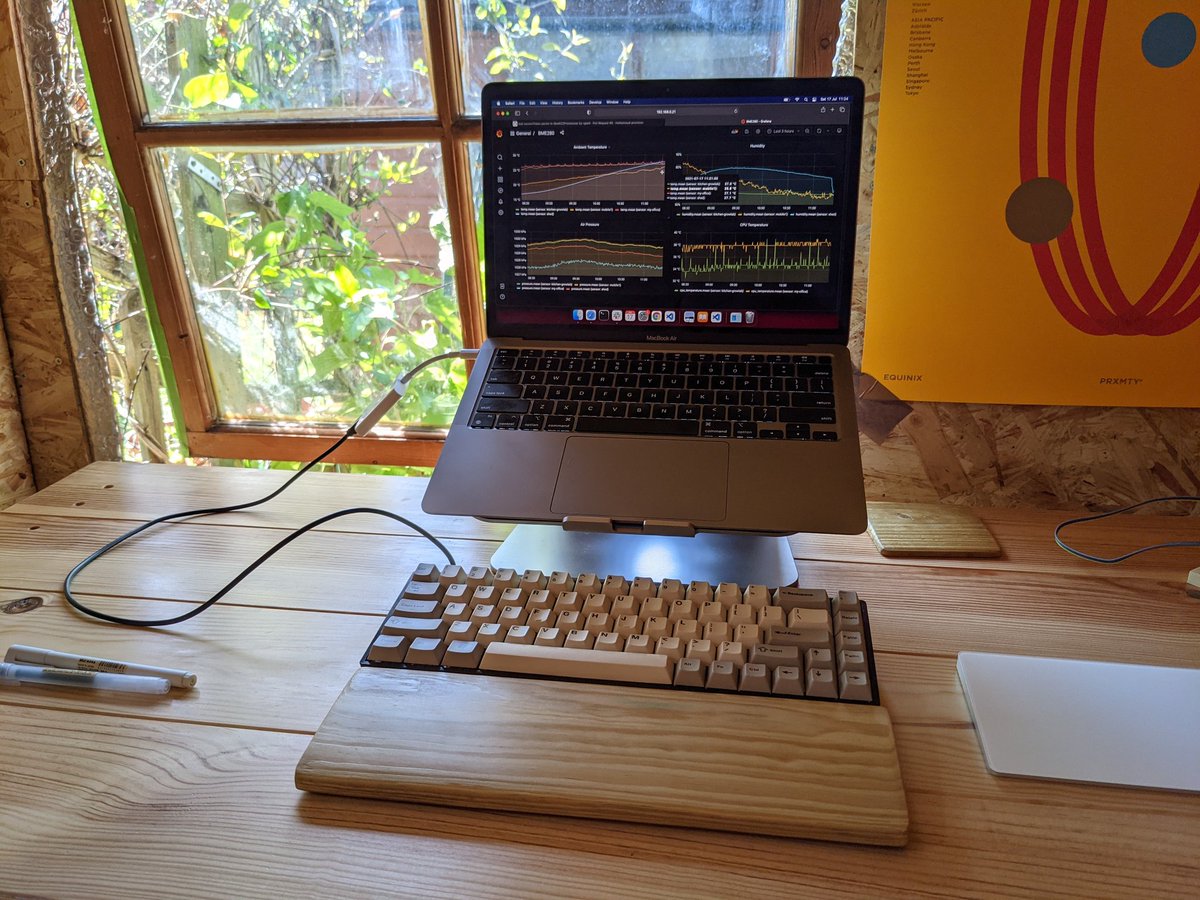
I built a simple dashboard is monitoring several key functions:
- Derek - installed on various GitHub organisations, derek helps reduce maintainer fatigue by reducing repetitive work
- Treasure Trove - my portal for GitHub sponsors - access all my technical writing back to 2019 and discounts on my eBooks
- Filter-tweets - triggered by If This Then That (IFTTT) - this function reads a JSON body, filters out spam and tweets by the openfaas account or by myself, then forwards the message onto a discord channel.
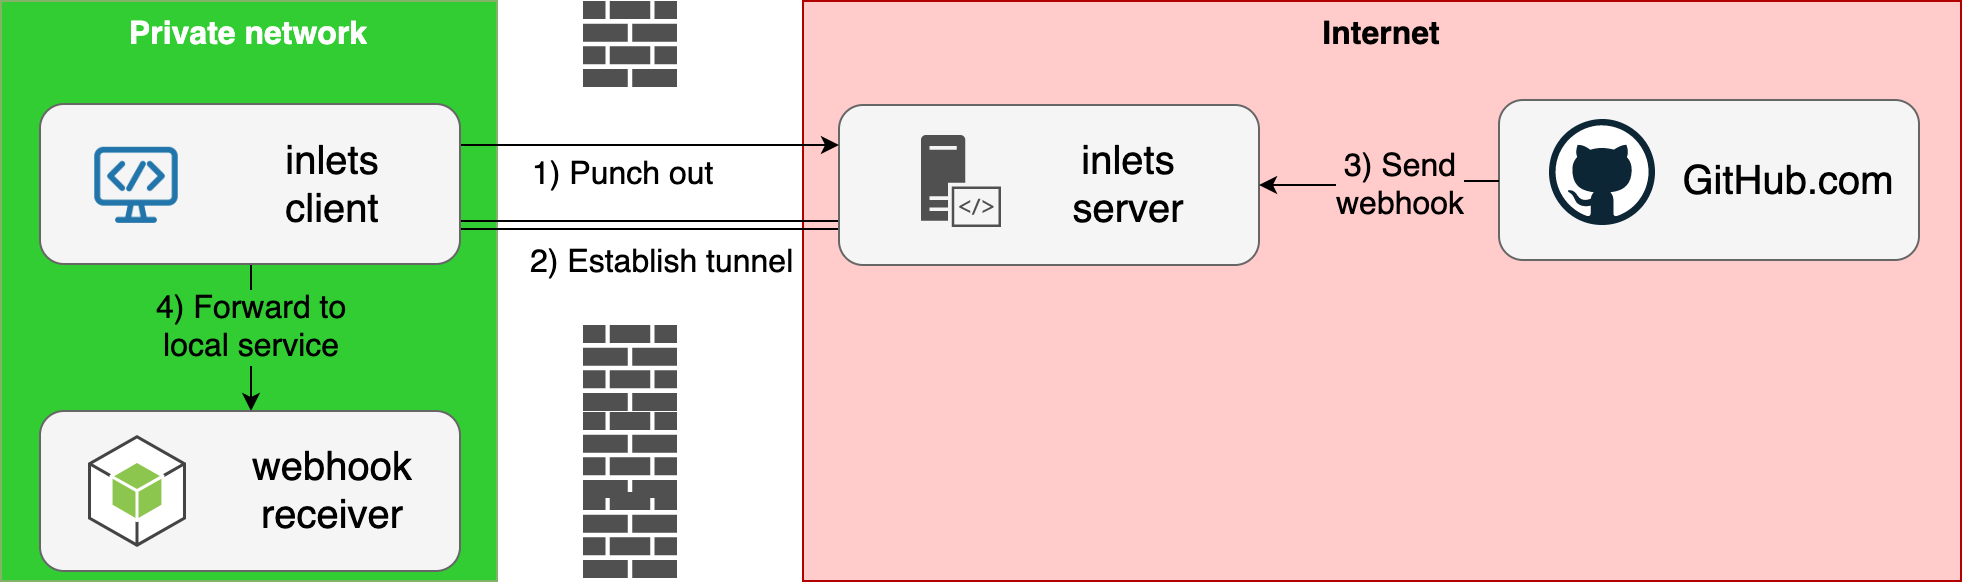
- Stars - installed as a webhook on the inlets, openfaas GitHub organisations and on some of my personal repos. It receives JSON events from GitHub and translates these to well-formatted Discord messages
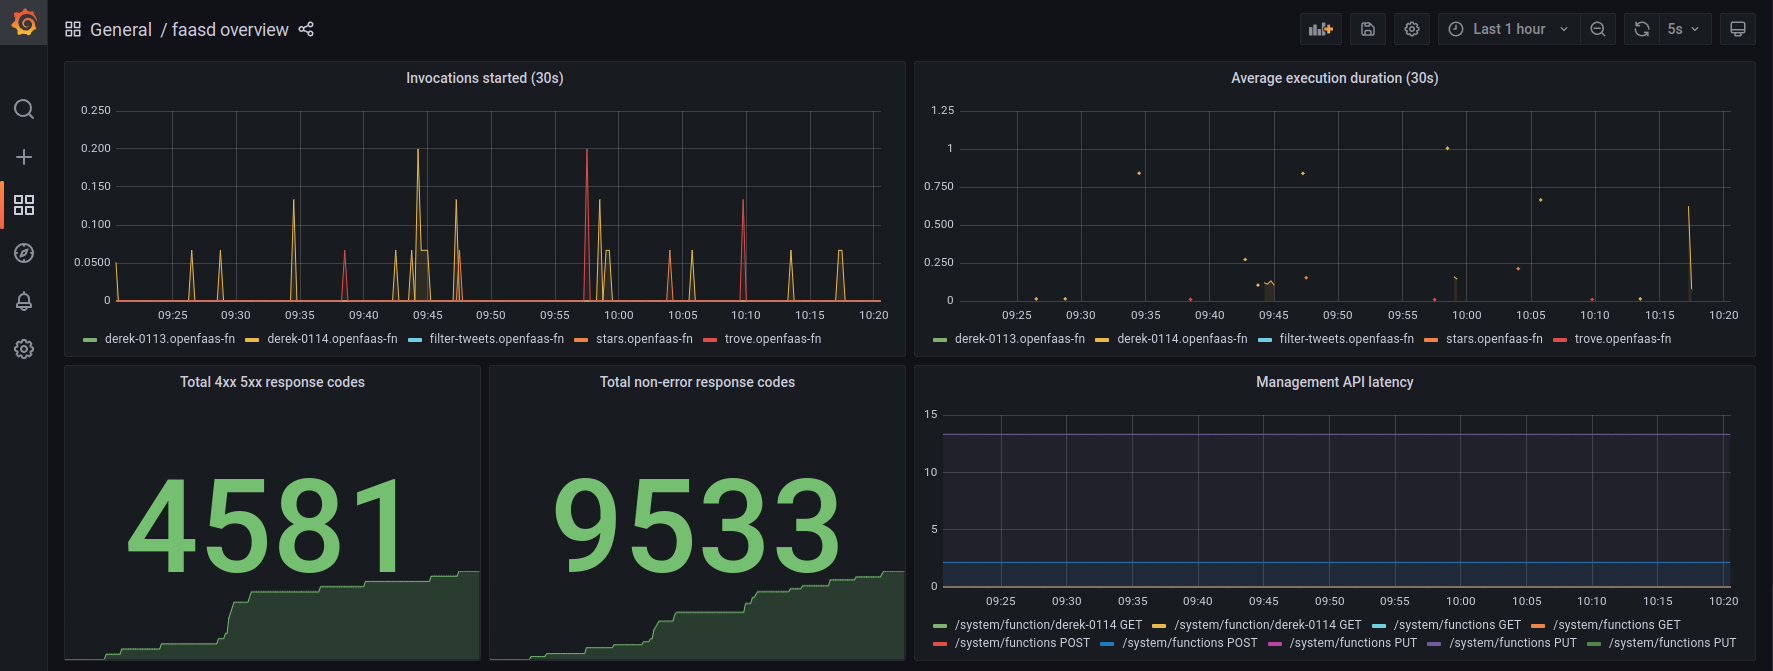
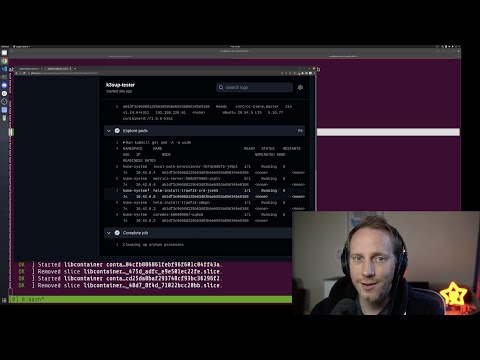
Built-in monitoring
The errors, or non-200/300 messages are from Derek, when the code receives an event from GitHub that it cannot process.
Wrapping up
I wrote this article to give you a taste of what kinds of things you can do with a pocket-sized cloud. My goals were to make it small, nimble, API-driven and most importantly, attainable. Kubernetes is an extremely versatile platform, but requires dozens more moving parts to run it in production.
Follow me, or share & discuss this article on Twitter
This isn't a Highly-Available (HA) or Fault Tolerant setup, but it's not meant to be either. One thing you can do to make things better, is to switch to a an NVMe SSD instead of using an SD card: Upgrade your Raspberry Pi 4 with a NVMe boot drive
If you think this concept is interesting and useful for your side projects, or a client project, you can also set up all the software on a cloud like DigitalOcean, Linode or AWS using an EC2 instance.
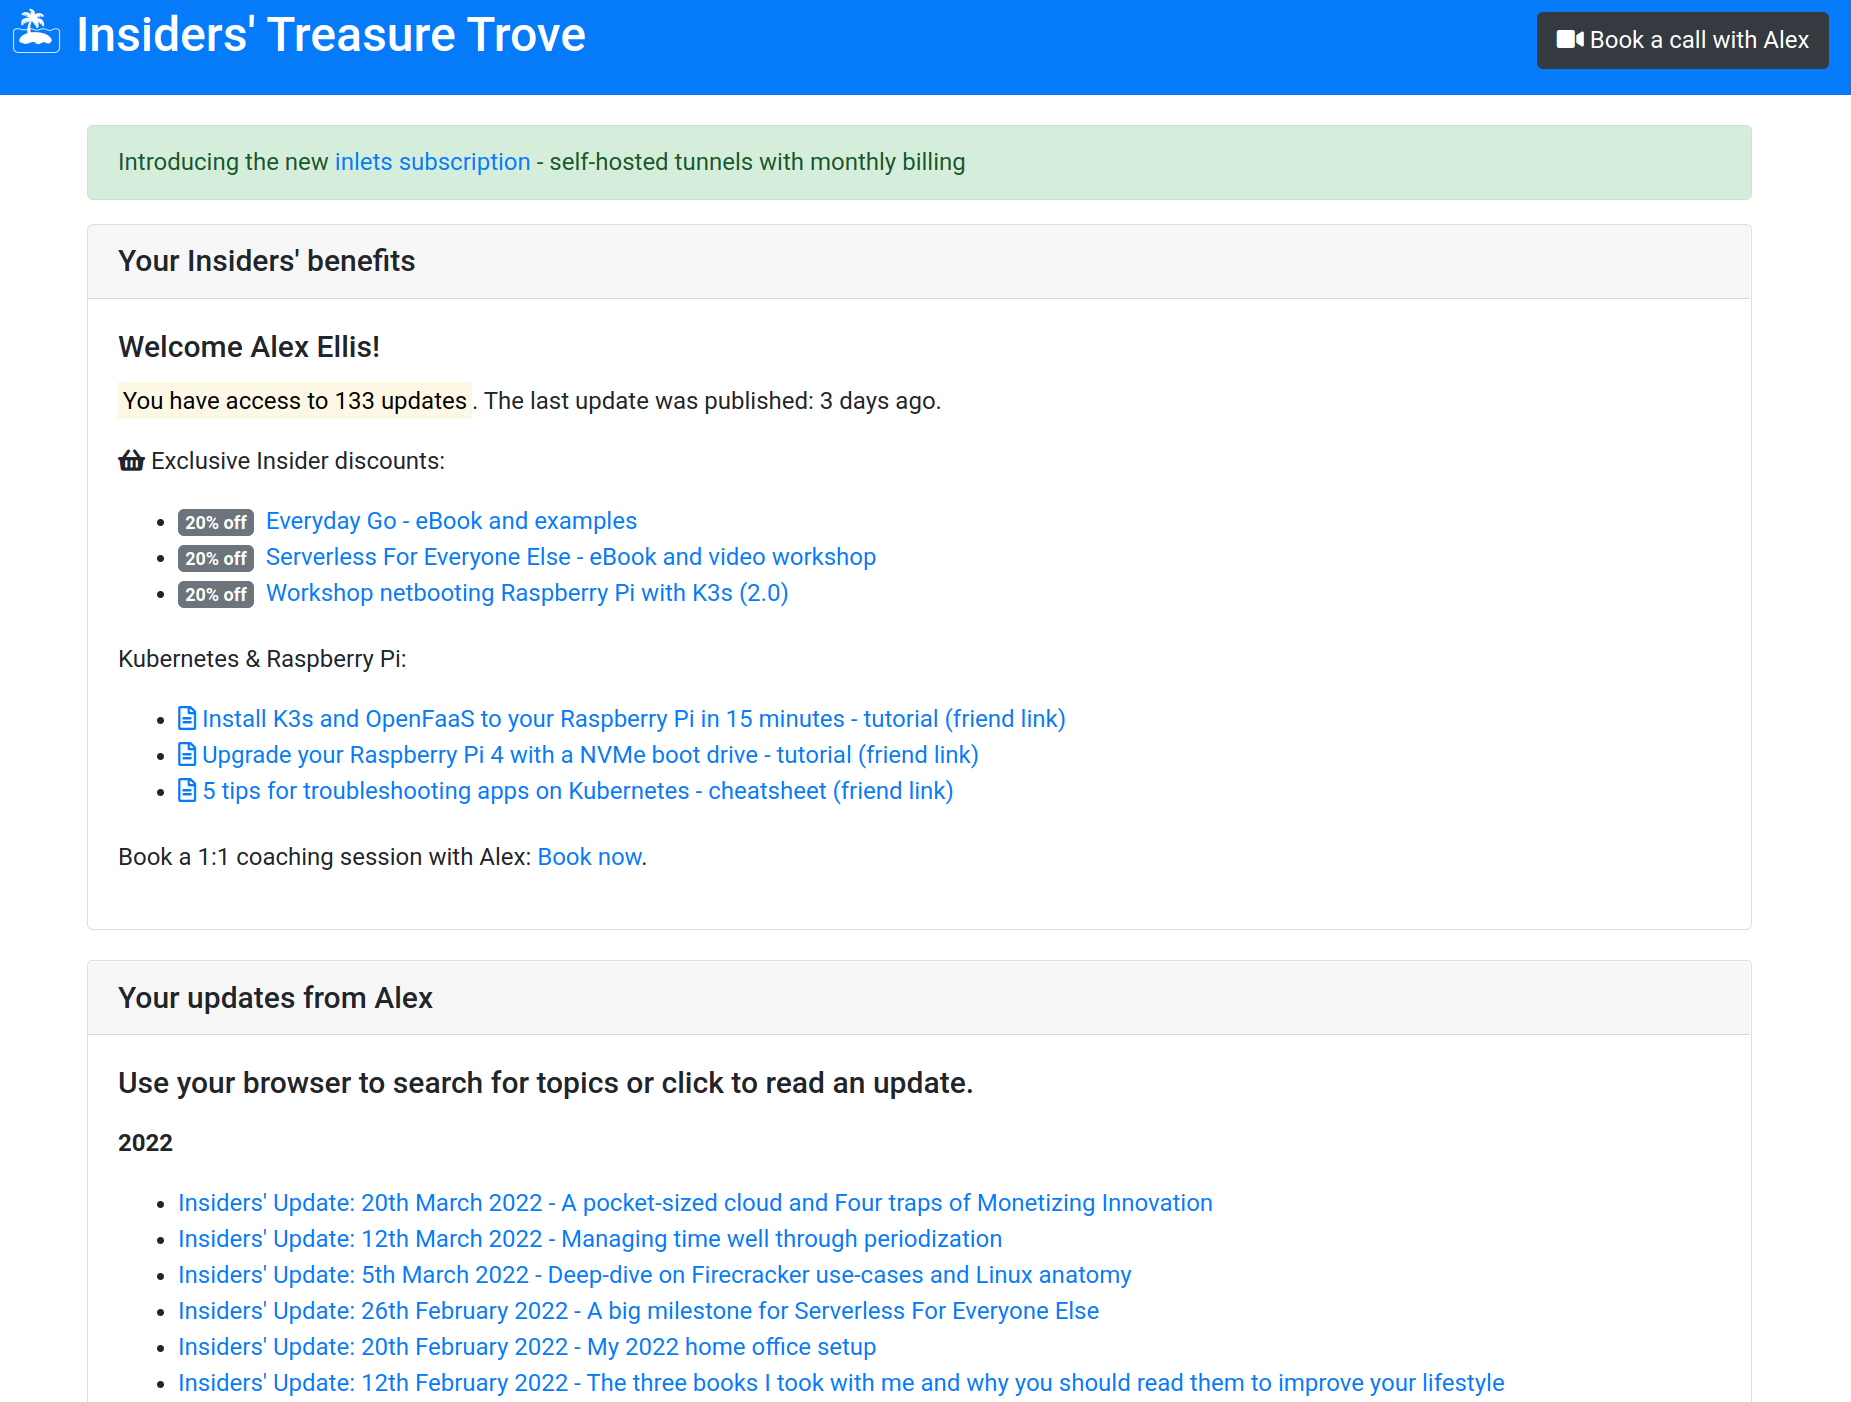
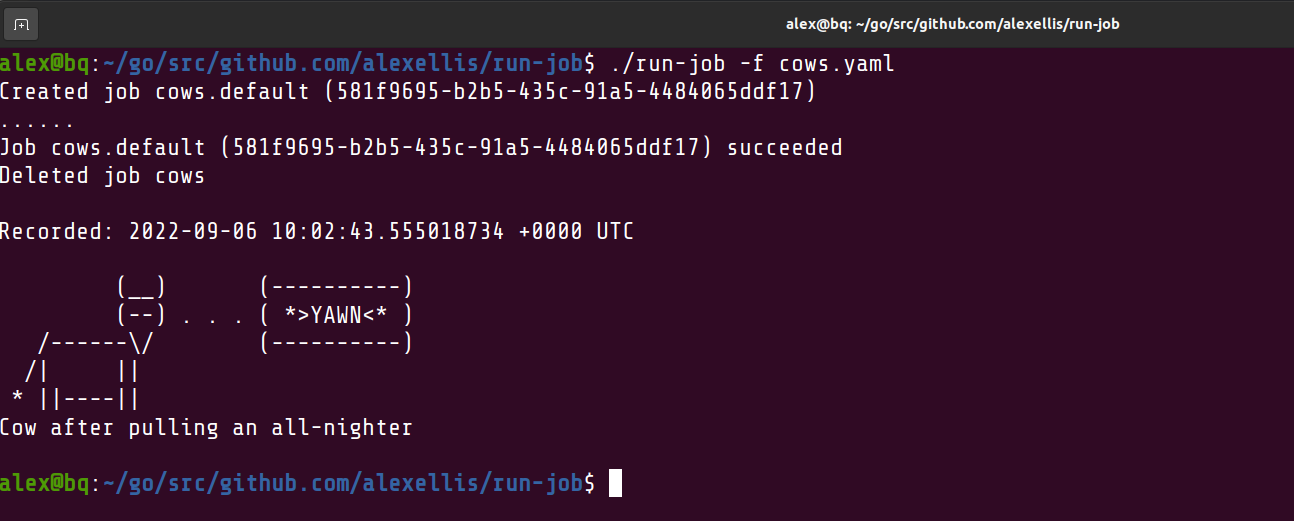
One of my functions running on faasd
I've been running the Treasure Trove on a Raspberry Pi 3 since 2019, I don't remember any downtime, but if the host went down for some reason, I'd simply run 3-5 commands and redeploy from a GitHub Action. If I was present at home, this could probably be completed within 30 minutes.
How many AWS or Kubernetes-related outages have you recovered from in 30 minutes?
For a deep dive on OpenFaaS, check out Ivan Velichko's write up: OpenFaaS - Run Containerized Functions On Your Own Terms
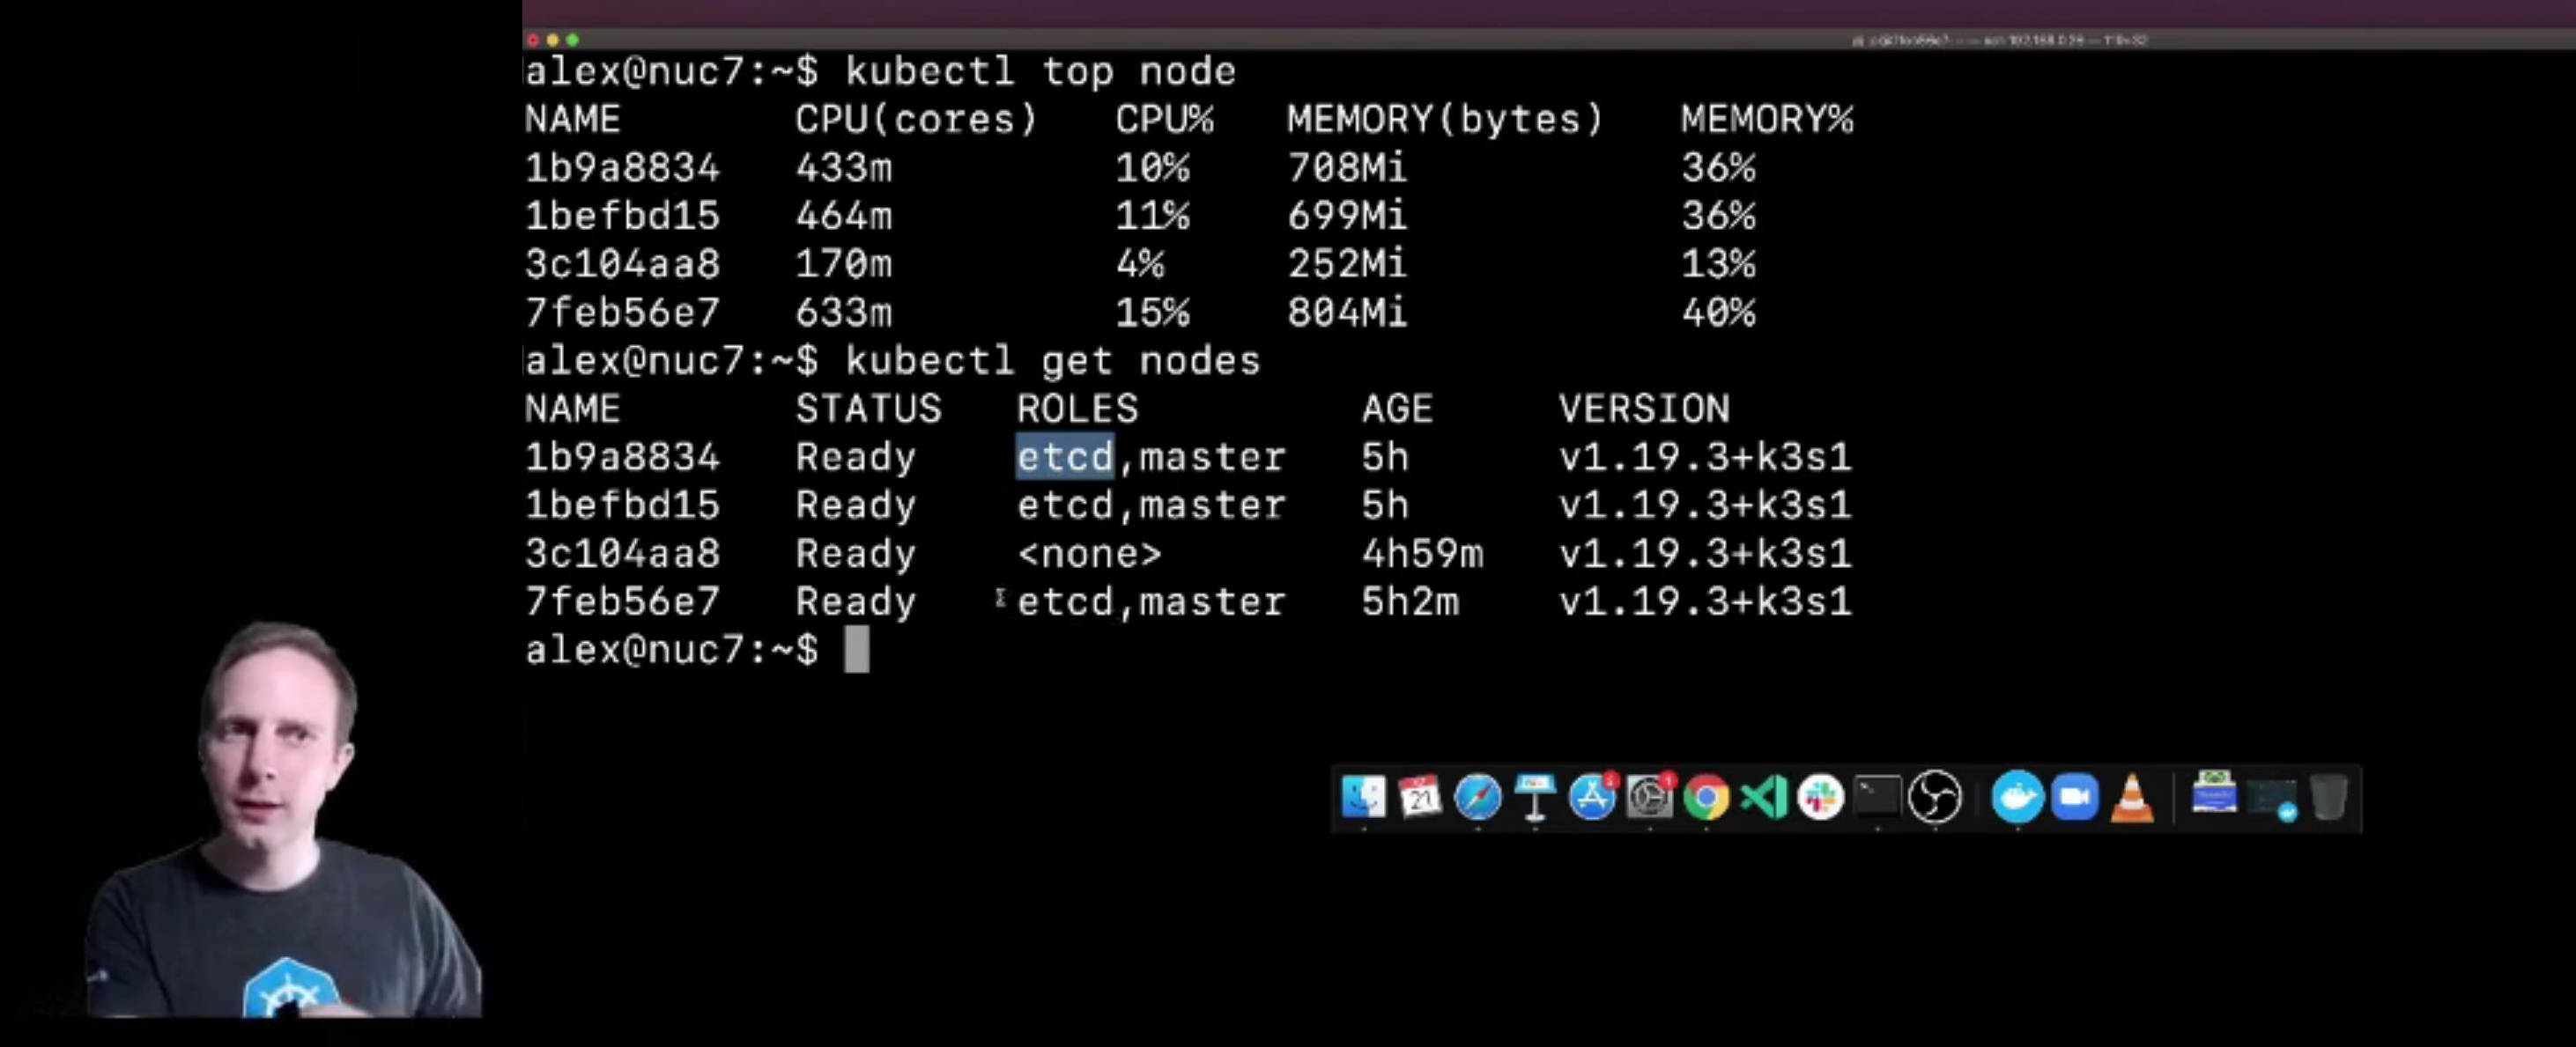
What about Kubernetes?
Kubernetes, with K3s is more suitable if you want to run more than device, or really fancy setting up your own cluster and getting closer to the NIST definition of "cloud".
You'll need 3-5 Raspberry Pis, so that you can tolerate at least one device failure, which will be a bigger investment, and eat up more of your compute power. But you may find the skils you built with your RPi cluster are useful at work, or your next gig. Here's my guide to Self-hosting Kubernetes on your Raspberry Pi
If you're interested in learning more about netbooting, I wrote up a workshop, a video tutorial and a set of automation scripts: Netbooting workshop for Raspberry Pi with K3s
Join us for a live event
On Friday 25th March at 12.00-13.30 GMT, I'll be joined by Martin Woodward - GitHub's Director of DevRel to build a pocket-sized cloud using a single Raspberry Pi. Together, we'll show you how to combine faasd and GitHub Actions for remote deployments of scheduled tasks, APIs and web portals.
Hit subscribe & remind, so you can watch live, or get a notification when the recording goes up:
Friday 25th March 12.00-13.30 GMT - Your pocket-sized cloud with OpenFaaS and GitHub Actions

 showing image vulnerability output from the new 'docker scout quickview' command. - dd418release f5")
 showing updates for vulnerable image after using the 'docker scout recommendations' command. - dd418release f4")
 comparing the vulnerability differences between two images and how the packages compare. - dd418release f2")


, and 48 vulnerabilities in 746 packages - docker desktop 419 f3")
 and Major OS version update (10-slim). - docker desktop 419 f4")

 ]
]


